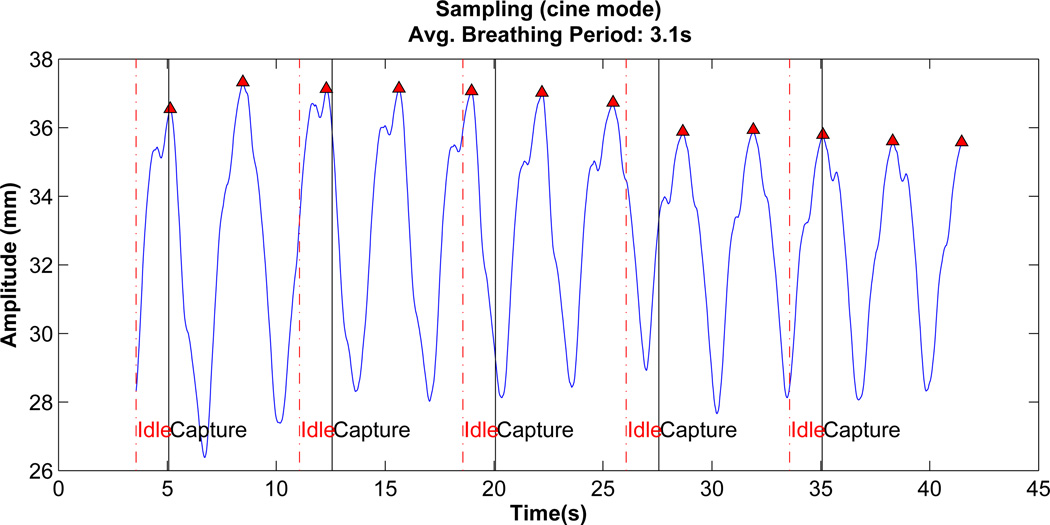
Figure 3.
Vertical lines represent clinical 4D CT (cine mode) data generation using the modified XCAT. The time period between solid line and broken line represent active data acquisition duration. Broken line to solid line represents time taken to move to next couch position before data is acquired again.

