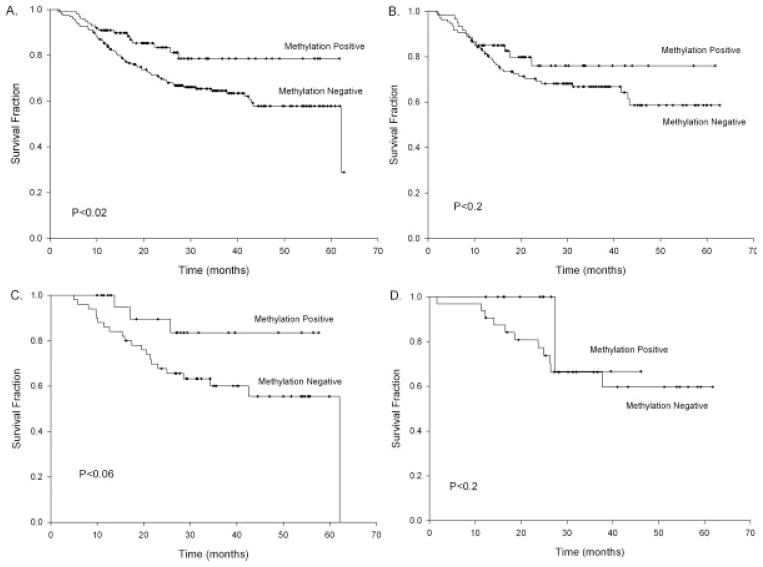
FIGURE 1.
These Kaplan-Meier survival probability plots compare cadherin 1, type 1/E-cadherin (CDH1) hypermethylation-positive tumors and hypermethylation-negative tumors in all patients with head and neck squamous cell carcinoma (n = 340) (A), only in patients with oral cancers (n = 194) (B), only in patients with pharyngeal cancers (n = 86) (C), and only in patients with laryngeal cancers (n = 58) (D). Tick marks represent censored values, and P values shown on graphs are the results of log-rank tests.

