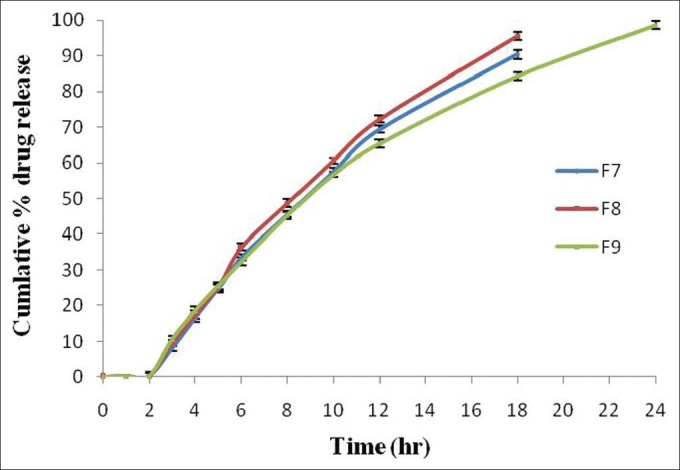
Figure 7.

Comparative in vitro drug release profile of optimized formulations (F7, F8, and F9) in the presence of rat cecal content (4% w/v). Data are represented as mean ± SD (n = 3)

Comparative in vitro drug release profile of optimized formulations (F7, F8, and F9) in the presence of rat cecal content (4% w/v). Data are represented as mean ± SD (n = 3)