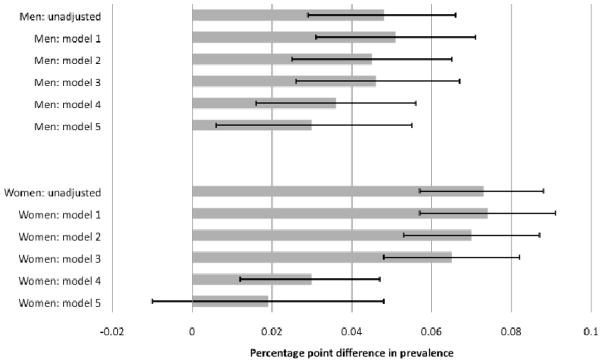
Figure 4. Estimated diabetes prevalence difference between US and England.

Notes to figure:
1. Solid bars indicate estimated prevalence differences, lines indicate 95% confidence interval around the estimates.
2. Positive values of prevalence indicate greater prevalence in the US.
3. Models 2–5 all include the following risk factors: age and age2, height and height2 and indicators of education, marital status and past smoking behavior.
4. BMI and waist adjustments in models 1–4 are as follows. Model 1: categorical BMI indicators; Model 2: categorical BMI indicators and categorical waist risk indicators (medium, high); Model 3: BMI (kg/m2) and BMI2; Model 4: BMI and BMI2, waist (cm) and waist2.
5. Model 5 contains the same adjustments as model 4, but with the effects of BMI and waist being allowed to differ in the two countries.
