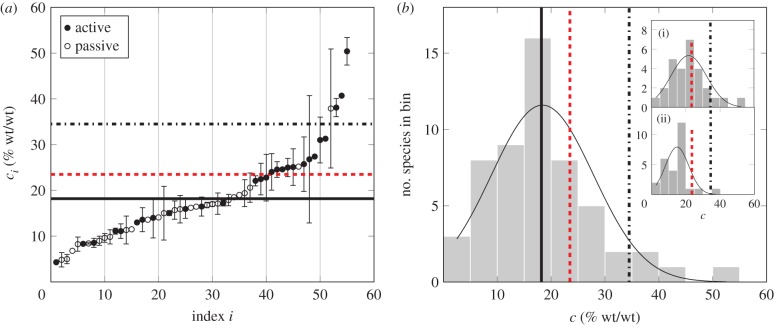
Figure 2.
Sugar concentration in phloem sap. (a) Sugar concentration ci for species number i as listed in table 2. Legend indicates phloem loading type. Error bars show standard deviation or range of concentrations reported. (b) Histogram showing distribution of sugar concentrations from (a). Inset shows histogram (i) for active and (ii) passive loaders. Thin solid lines are normal distributions fitted to the histograms as a guide to the eye. In (a,b), the thick solid line indicates the mean value 18.2% of phloem sap concentrations given in (a) (table 1). Dashed line indicates the optimum concentration 23.5% for flows driven by constant pressure while the dash-dotted lined indicates the optimum concentration 34.5% for flows driven by concentration-dependent pressure. (Online version in colour.)

