
Figure 2.
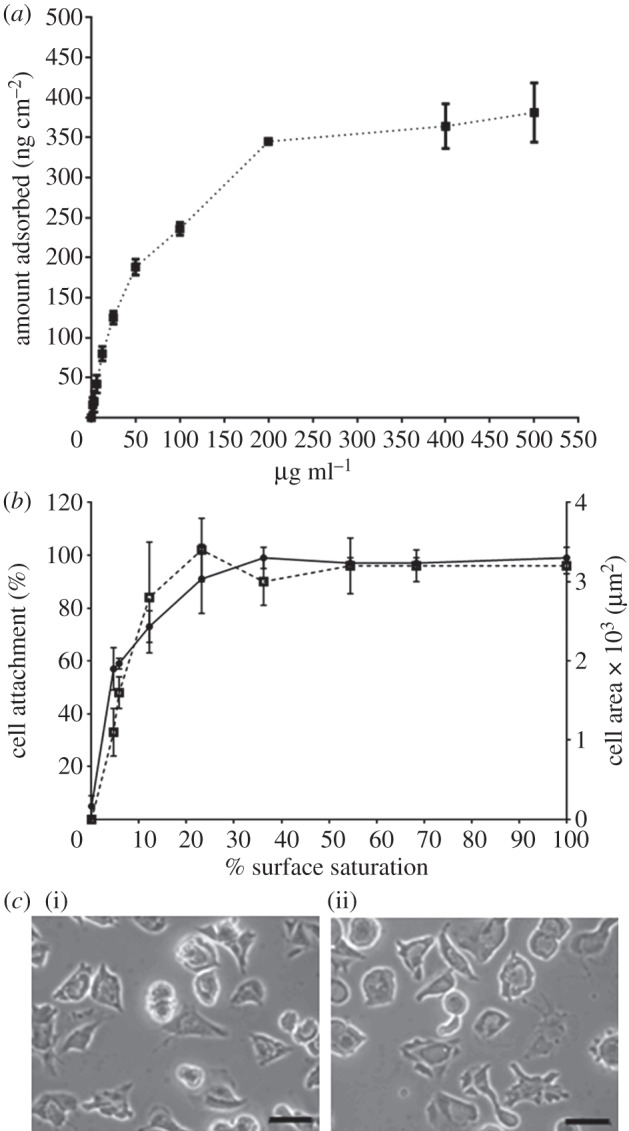
(a) Fibronectin adsorption to TCPS determined by quantification of adsorbed fluorescently labelled fibronectin on TCPS, after 1 h of incubation at 37°C, the amount of adsorbed fibronectin recovered by trypsinization being quantified using a standard curve as described in §2. (b) The effect of fibronectin surface saturation on initial HUES7 cell attachment (circles with solid line, where n = 3), and spreading after 2 h of culture, where cell spreading is represented in terms of mean cell area (squares with dotted line, where n = 50). Percentage surface saturation was calculated using 345 ± 3 ng cm−2 as 100% surface saturation. (c) The effect of fibronectin surface saturation at (i) 25 and (ii) 70% on cell morphology after 2 h of culture. Scale bar, 50 μm.