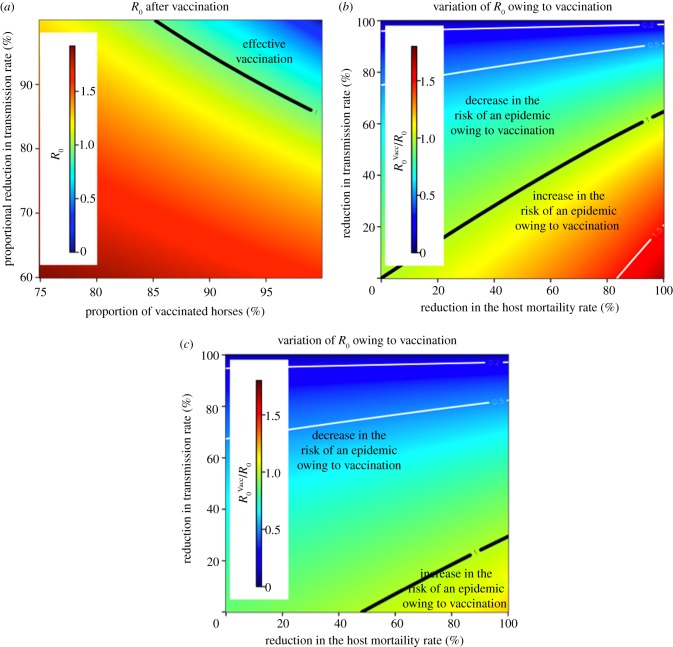
Figure 7.
Effect of vaccination on R0. (a) R0 owing to vaccination as a function of the proportion of vaccinated horses and the reduction factor in the transmission rate. Parameters in the top-right region are expected to lead to the extinction of the epidemic. The initial value of R0 for un-vaccinated horses is 2.6, which leads to a vaccination coverage (for a uniformly mixing host–vector population) greater than 100(1−1/2.62) = 85% in order to block transmission. (b) Relative variation of R0 when 100% of horses are vaccinated compared with R0 in the absence of vaccinated horses as a function of the reduction in the host mortality rate and the reduction factor in the transmission rate. A sensible reduction in the host mortality rate might lead to an increase in R0. (c) As in (b) but the mean duration of viraemia is assumed to be reduced by 50% as an additional effect of vaccination. Temperature 22.5°C, b = 0.7530, β = 2.7 × 10⁻², dH = 0.4, 1/rH = 6,  , nH = 4, unbiased feeding preference.

