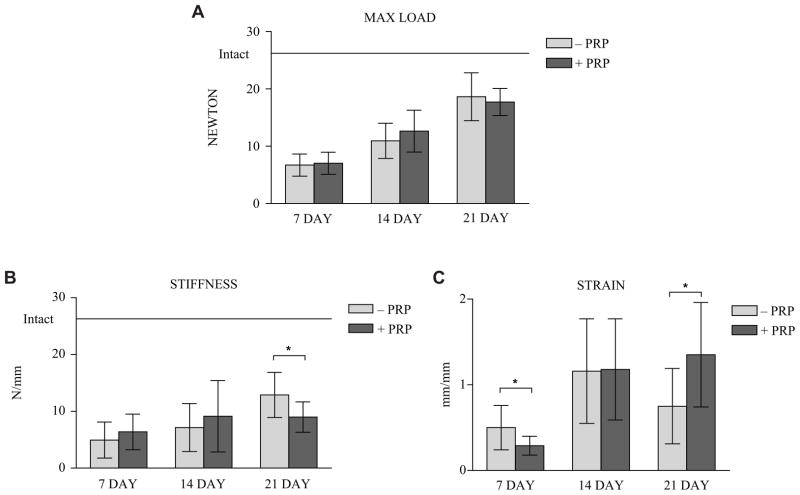
Figure 2.
Maximum load (A), stiffness (B), and strain (C) data at 7-, 12-, and 21-day points for comparison. Error bars are 1 standard deviation. *Significant value (P <.05). Solid horizontal bar indicates intact tendon values. Because of intrasubstance failure of the intact tendons, strain data were not considered comparable and therefore not completed. PRP, platelet-rich plasma.

