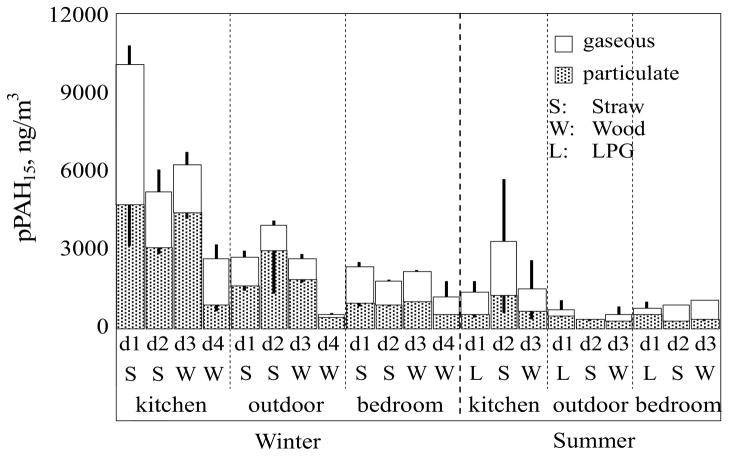
Figure 1.
Daily pPAH15 (total of 15 USEPA priority PAHs) concentrations in the kitchen, adjacent bedroom, and outdoors in the winter (four days from d1 to d4) and summer (three days from d1 to d3). The stacked bars represent gaseous (top) and particulate (bottom) phase PAH concentrations. The results are shown as arithmetic means and standard deviations (the whisker pointing up and down represent standard deviations for the particulate and gaseous phases, respectively, derived from the duplicate sampling).

