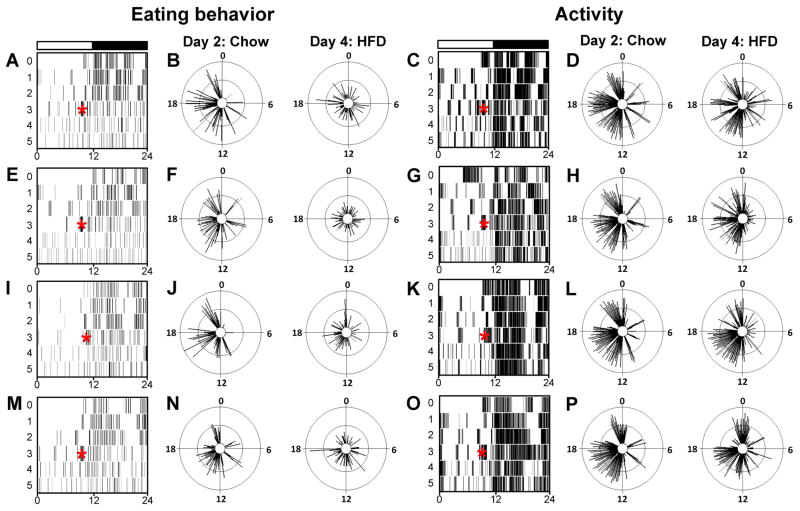
Fig. 5.
The eating behavior rhythm is altered by a high-fat diet (HFD). Single-plotted actograms (1-min bins; maximum 1 count/bin; x-axis: time in h; y-axis: days) of eating events (A, E, I and M) and locomotor activity (C, G, K and O) from male wild-type mice maintained in a 12-h light/12-h dark cycle (light and dark indicated by black and white bars, respectively, above actograms). Eating behavior (scored from video collected by infrared camera) and general activity (monitored with passive infrared sensors) were simultaneously collected from the same mouse. On day 0, the mouse was singly housed and provided with chow ad libitum. On day 3, chow was replaced with a HFD (~2.5 h before lights off, indicated by asterisks on the actograms). Circular histograms (plotted in 2.5° bins) show the distribution of eating events (B, F, J and N; scale: inner circle, 0; middle circle, 4.5; outer circle, 9) and activity events (D, H, L and P; scale: inner circle, 0; middle circle, 6.5; outer circle, 13) for each mouse during chow (left panels, day 2 of actogram) and a HFD (right panels, day 4 of actogram) consumption relative to the time of day (where ZT0 is lights on and ZT12 is lights off). The mean vectors are reported in

