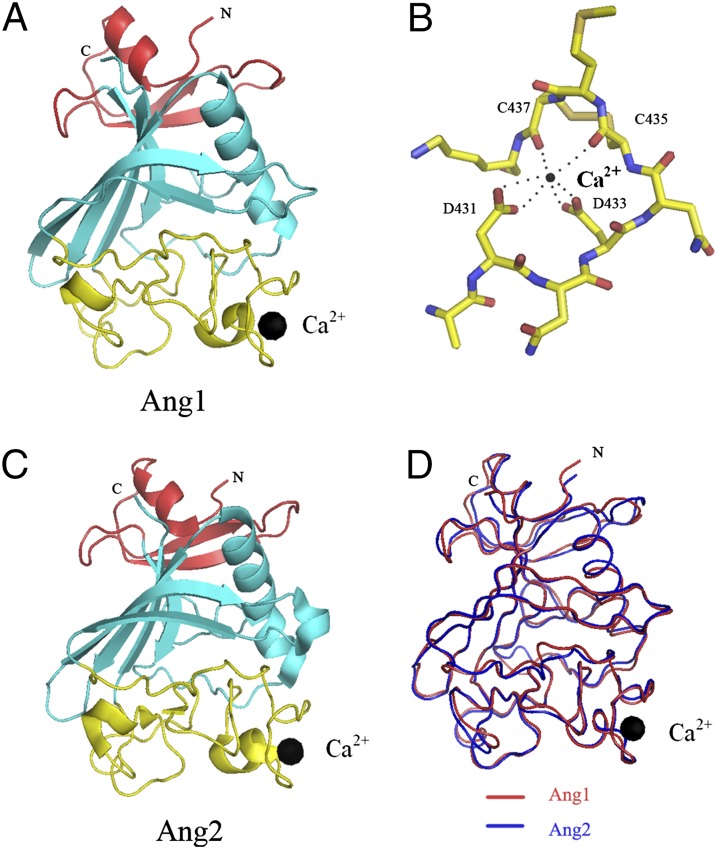
Fig. 1.
Structure of the Ang1-RBD. (A) The refined model of Ang1-RBD with the individual subdomains shown in different colors (A domain, red; B domain, cyan; P domain, yellow). The black sphere represents the bound calcium atom. (B) Close-up view of the Ca2+-binding site. (C) Structure of the previously determined Ang2-RBD colored as in A. (D) Structural alignment in coil representation of the Ang1-RBD (shown in red) and the Ang2-RBD (shown in blue).

