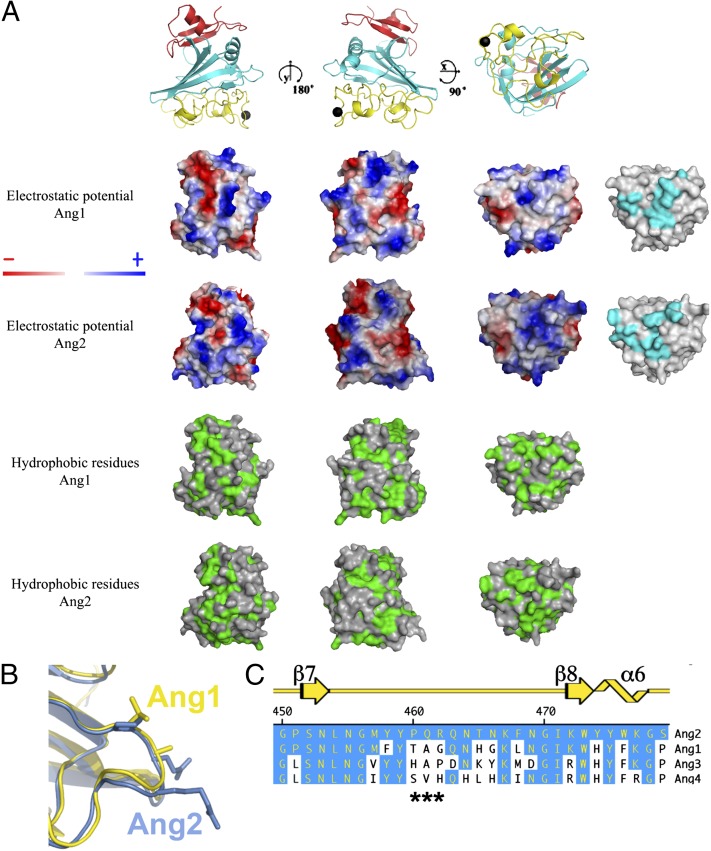
Fig. 3.
Conservation between Ang1-RBD and Ang2-RBD. (A) Electrostatic surface potential of Ang1-RBD (top row) and Ang2-RBD (second row from the top) and surface hydrophobicity of Ang1-RBD (third row from the top) and Ang2-RBD (last row). Secondary structures of Ang1-RBD are illustrated above the image to aid in model orientation. Surfaces residues involved in receptor recognition are shown in cyan for Ang1 and Ang2 on the right. (B) Close-up view of the β7-β8 loop in Ang1 (yellow) and Ang2 (blue). (C) Primary sequence alignment of the β7-β8 loop within Ang1 to -4. Regions that are conserved relative to Ang2 are shown in blue. Secondary structure is depicted in yellow at the top.

