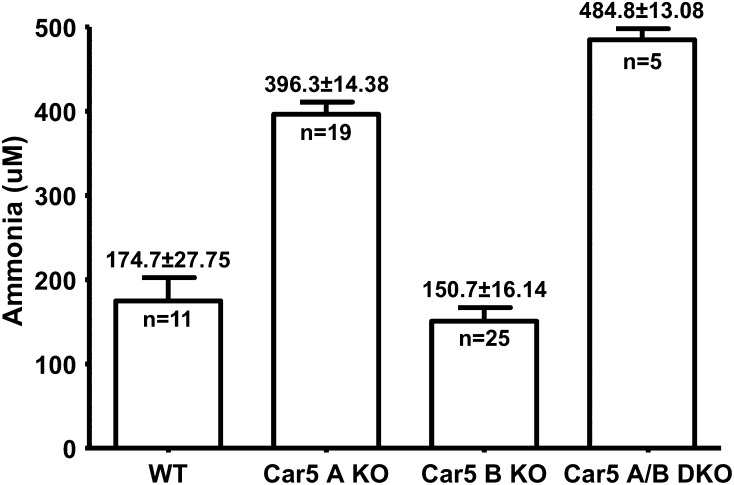
Fig. 5.
Ammonia concentration in the blood of WT, Car5A, and Car5B null mice and the DKO animals. Plasma ammonia levels were measured in the fed state for each of the genotypes shown. The statistically significant elevations in the Car5A mice are described in Results, as is the even greater elevation seen in the DKO mice.

