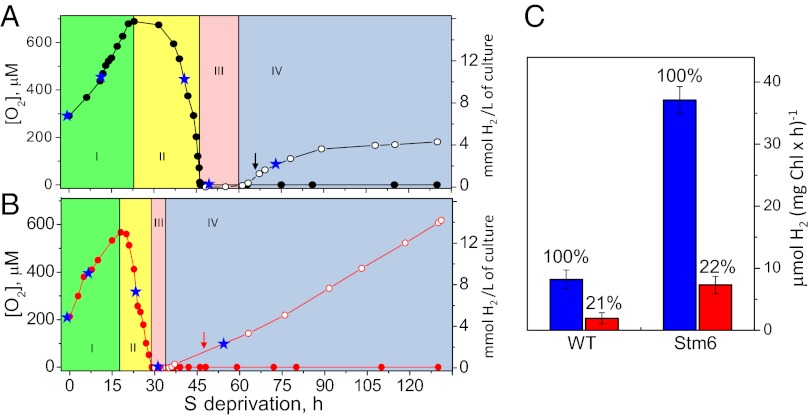
Fig. 1.
Changes in the concentration of dissolved O2 (filled circles) and produced H2 (open circles) during incubation of WT (A, black circles) and the Stm6 mutant (B, red circles) of C. reinhardtii under S-deprived conditions in sealed flasks. Reflecting the O2 and H2 concentrations, the time course was divided into four phases: I—the O2 evolution phase; II—the O2 consumption phase; III—the anaerobic phase; and IV—the H2 production phase. The blue stars in each phase indicate the time points for EPR and fluorescence experiments. The sample at t = 0 was taken as a control. (C) The effect of the addition of 20 μM DCMU on the rate of H2 production. The aliquots of the cell culture were taken as described in the text at the time points indicated by arrows in A and B. The amount of H2 formed in the respective strains in the absence of DCMU (blue) is set as 100%. The fraction of H2 formed in the presence of DCMU (red) was similar in both WT and the Stm6 mutant whereas the net amount of H2 formed was four times greater in the mutant.

