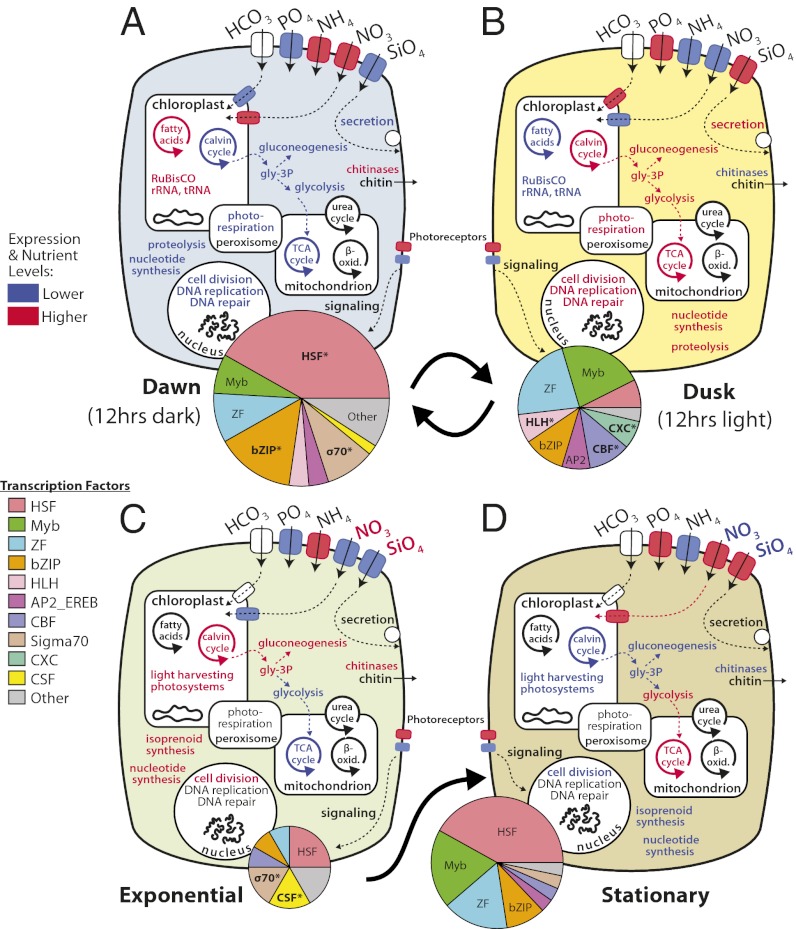
Fig. 2.
Schematic of physiological and transcriptional states of T. pseudonana during diurnal growth. Pathways and functions associated with each state are highlighted. (A) Dawn following 12 h of darkness. (B) Dusk following 12 h of light. (C) Exponential growth in replete nutrients. (D) Stationary phase and nutrient depletion. Those pathways highlighted in red contain genes significantly up-regulated, those in blue contain genes significantly down-regulated, and those in black do not display conditional associations. The association of putative transcription factors (TFs) with each state is depicted in pie charts whose sizes are proportional to the total number of associations detected. TFs that were significantly enriched under a condition are marked with an asterisk.

