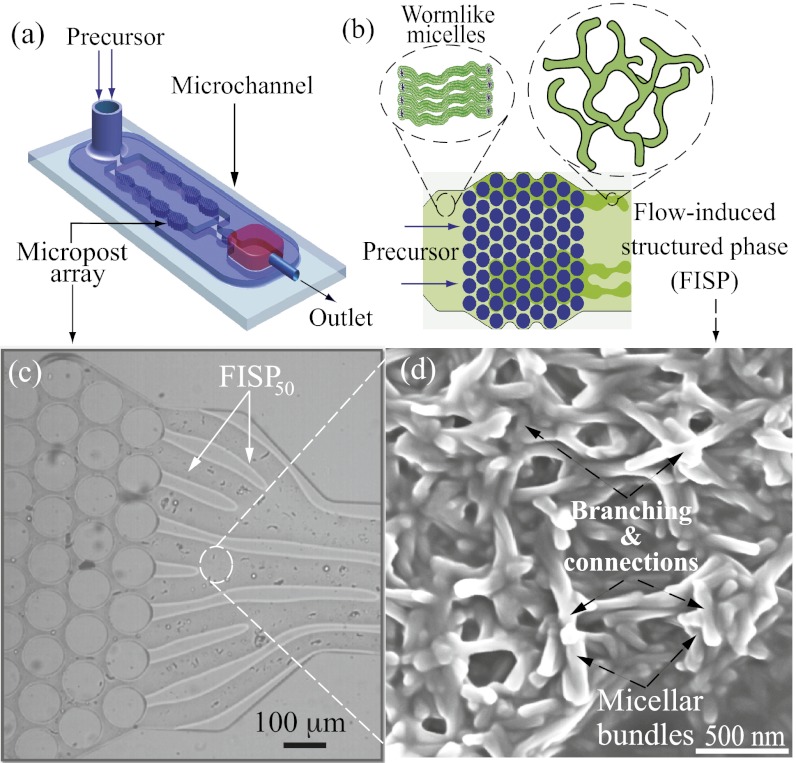
Fig. 1.
(A and B) Schematics of the microdevice. When the precursor passes through the micropost array, it undergoes high strain rates of  and total strain of
  , leading to FISP formation. (C) Snapshot shows the “finger-like” FISP formation. (D) High-resolution SEM image of FISP50 at a magnification of 100,000× under high voltage of 3.00 kV.

