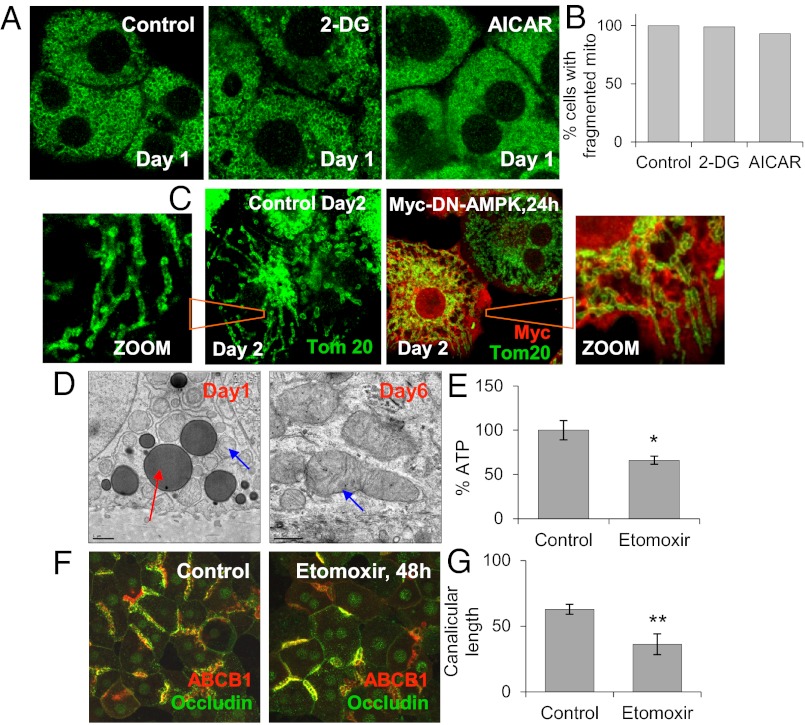
Fig. 5.
AMPK activation is not correlated with mitochondrial fusion. (A) Immunofluorescence analysis of mitochondrial outer membrane protein Tom20 in day 0 cells treated with AMPK activator 100 mM 2-DG and 250 μM AICAR for 24 h. (B) Percentage of cells with fragmented mitochondria, normalized to control. (C) Immunofluorescence analysis for Tom20 (green) or Myc (red) in day 1 cells infected with Myc-DN-AMPK adenovirus, at 24 h postinfection. (D) TEM image of lipid droplets in day 1 and day 6 cells (red arrow, lipid droplets; blue arrow, mitochondria). (E) Percentage of ATP after treatment of day 1 cells with 100 μM etomoxir for 48 h. Data are from three individual experiments. *P < 0.05 compared with control. (F) Immunofluorescence of occludin (green) and ABCB1 (red) in day 1 cells treated with 100 μM etomoxir for 48 h. Merged projection images were from Z-serials of confocal images. (G) Canalicular lengths from three individual experiments. **P < 0.01 compared with control.

