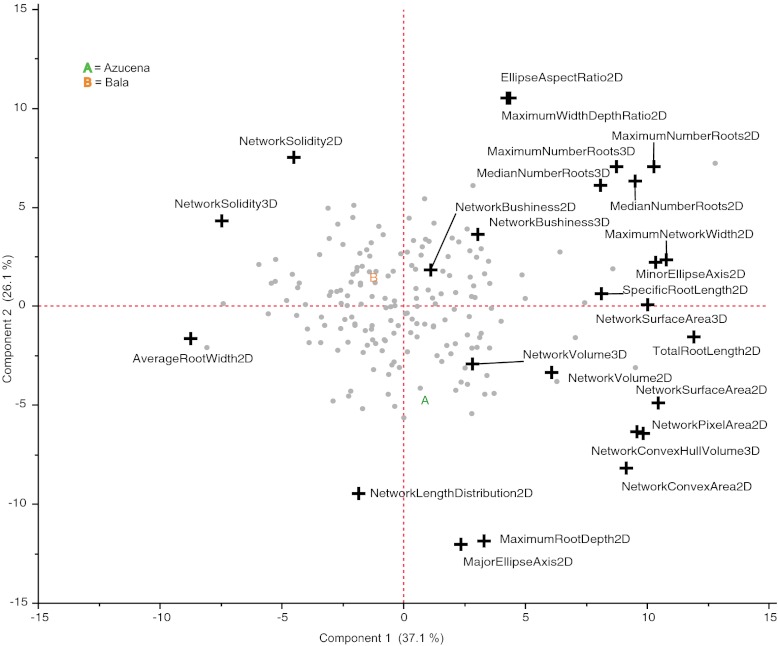
Fig. 3.
PCA on root trait correlations in the RIL and parental lines. Gray dots represent the genetic means of each RIL family; “A” (Azucena) and “B” (Bala) are the parental family means. Crosses indicate the loadings for each trait along the first two components, which comprise 63% of the total genetic variation for all 25 traits. Full PCA statistics are reported in Fig. S1.

