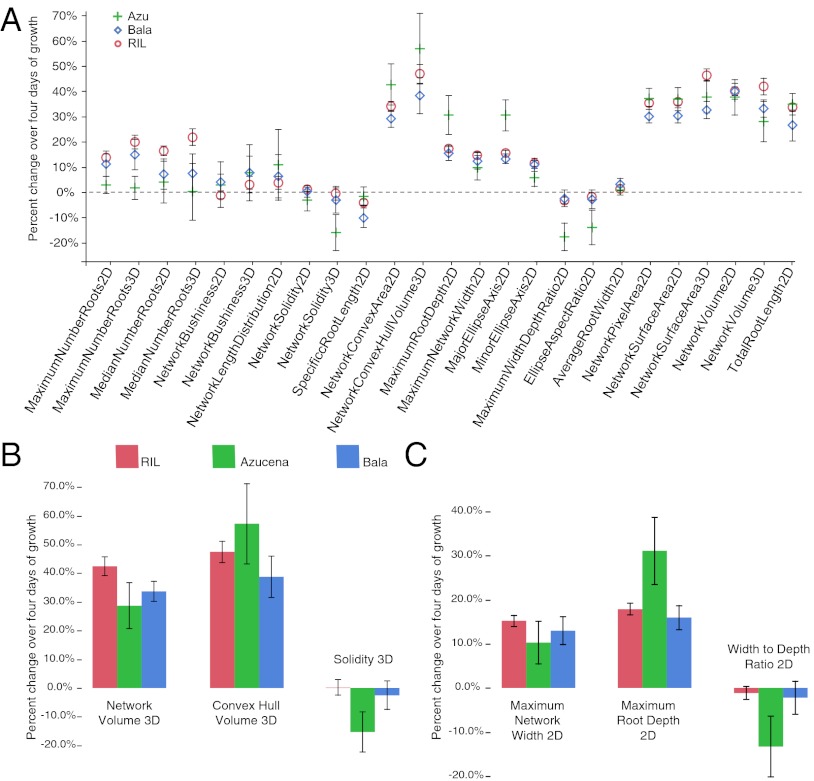
Fig. 4.
Trait dynamics during 4 d of growth. (A) Percent changes for all 25 traits were calculated by subtracting average day 12 values from day 16 values and dividing by day 12. (B and C) Differences among RILs, Bala, and Azucena in the rates of change for ratios solidity 3D (C) and width:depth 2D and their constituent traits are shown in greater detail. Error bars represent 95% confidence intervals of the mean. All growth rates are reported in Table S2.

