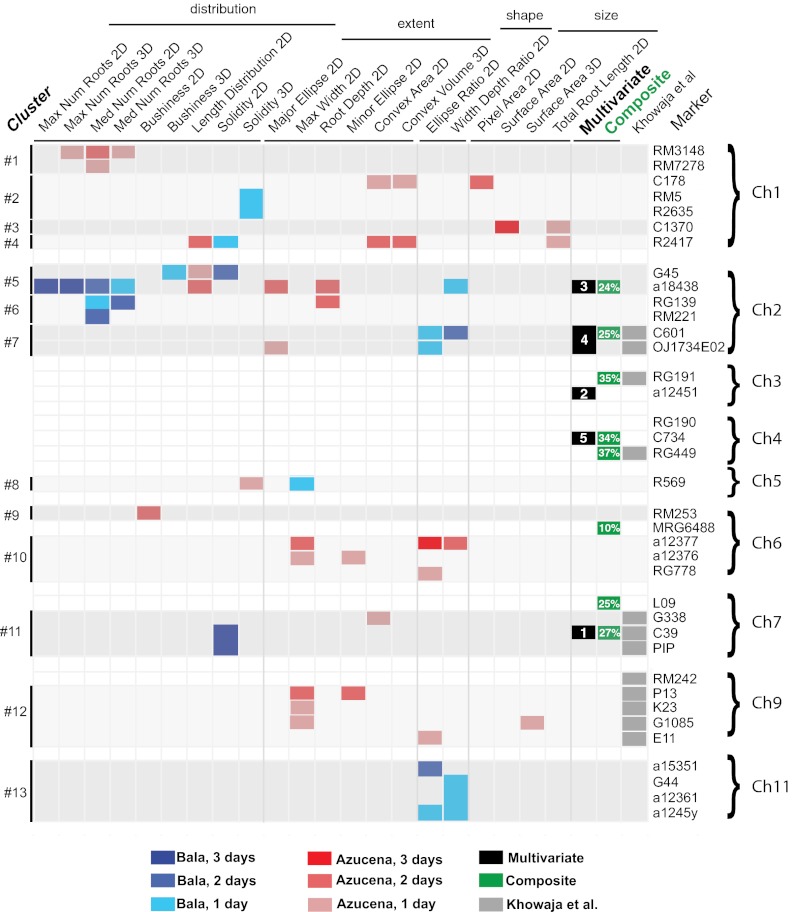
Fig. 6.
Genetic landscape of RSA QTL. Blue (Bala) or red (Azucena) color indicates the parent contributing the positive allele. Univariate QTLs on multiple days for the same trait are coded by hue. Columns indicated by darker gray lines separate traits by measurement type. Root trait hotspots identified by Khowaja et al. (29) that colocalize with those identified in this study are shown in gray. Multivariate QTLs are shown in black with significance rank (full results are given in Dataset S3), and the corresponding DFA-derived composite QTLs are shown near them in green, with percentage indicating phenotypic effect size (full results are given in Fig. 8). The composite QTL on chromosome 6 at MRG6488 corresponds to multivariate rank #2 at a18438, and the composite QTL on chromosome 7 at L09 corresponds to multivariate rank #1 at C39. For clarity, only markers associated with QTLs are shown. Clusters are grouped by linearity and proximity on the genetic map.

