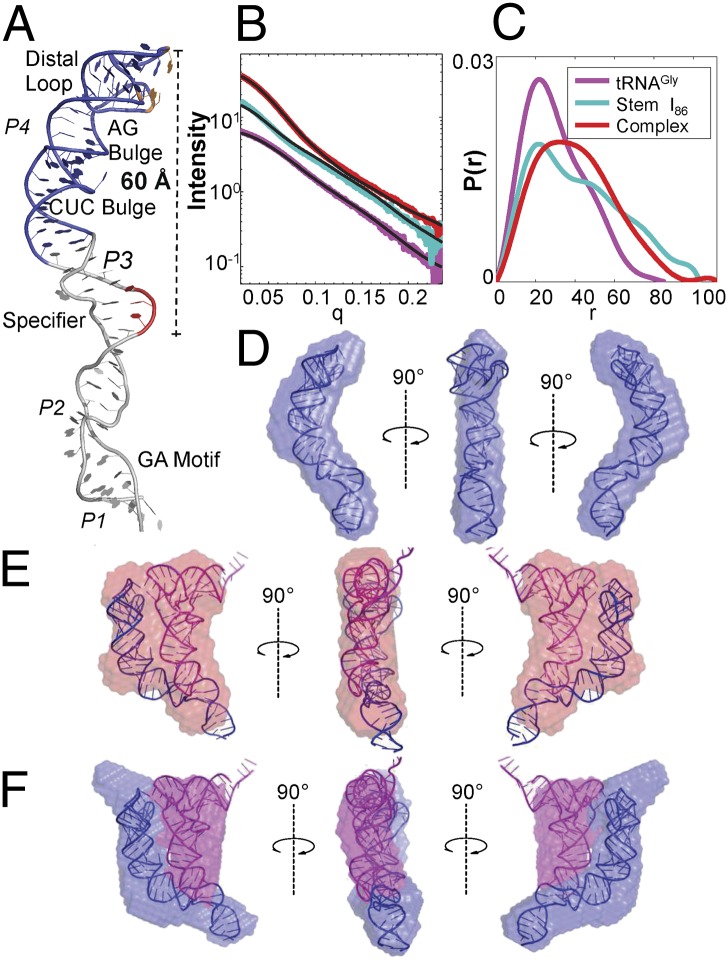
Fig. 5.
Model for stem I–tRNA interaction. (A) Hypothetical model of stem I constructed from the stem I57 crystal structure (blue) and stem I base NMR structure (gray) (PDB ID 2KZL). The specifier sequence and apical base triple are highlighted in red and orange, respectively. (B) Experimental SAXS curves and (C) pair distance distribution function P(r) of the tRNA (magenta), T box–stem I86 (cyan), and stem I86–tRNA complex (red). Black lines represent the theoretical scattering profiles calculated by CRYSOL from the tRNA crystal structure (PDB ID 2J00) and our predicted structures of T box stem I86 and its complex. (D) Docking of the T box stem I86 model into the SAXS-reconstructed envelope from DAMMIF. (E) Docking of the stem I86–tRNA complex model into the SAXS-reconstructed envelope from DAMMIF. (F) Docking of the stem I86–tRNA complex model into the averaged two-phase MONSA-reconstructed model.

