
Fig. 2.
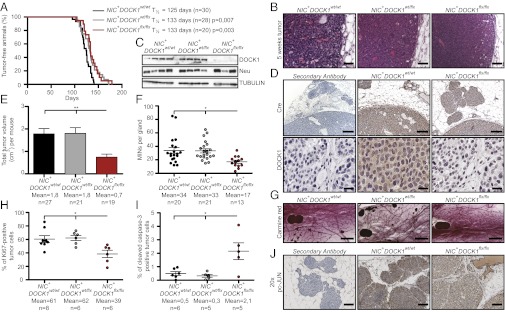
DOCK1 contributes to HER2 tumorigenesis in a mouse model of breast cancer. (A) Kaplan–Meier analysis of tumor onset. NIC+DOCK1wt/flx and NIC+DOCK1flx/flx mice display a minor delay in tumor onset. (B) H&E staining showing that all animals develop tumors with an adenocarcinoma histology. (Scale bar: 100 µm, 20×.) (C) Western blot analyses demonstrating the absence of DOCK1 and equal Neu expression in tumor lysates. (D) IHC analyses showing Cre (Upper) and DOCK1 (Lower) expression in NIC+DOCK1wt/wt and NIC+DOCK1flx/flx tumors. (Scale bar: Upper, 250 µm, 10×; Lower, 50 µm, 40×.) (E) DOCK1 contributes to HER2-induced tumor growth. Average cumulative tumor burden per animal (in cubic centimeters). (F) NIC+DOCK1flx/flx mice develop fewer mammary intraepithelial neoplasic lesions (MINs). Quantification of mammary MINs per tumor-free mammary gland 5 wk after tumor onset is presented. (G) Representative carmine red staining of mammary glands showing MINs in all genotypes. (Scale bar: 1 mm, 2.5×.) (H) DOCK1 promotes cell proliferation in HER2 tumors. Average percentage of Ki67-positive cells in tumors. (I) DOCK1 exerts an antiapoptotic role in HER2 tumors. Average percentage of activated caspase-3–positive cells in tumors. (J) Impaired c-JUN activation in DOCK1-null HER2 tumors. IHC analyses showing pc-JUN levels in MINs. (Scale bar: 100 µm, 20×.) One-way ANOVA followed by a Bonferroni test calculated the P values; *P ≤ 0.05 and **P ≤ 0.01.