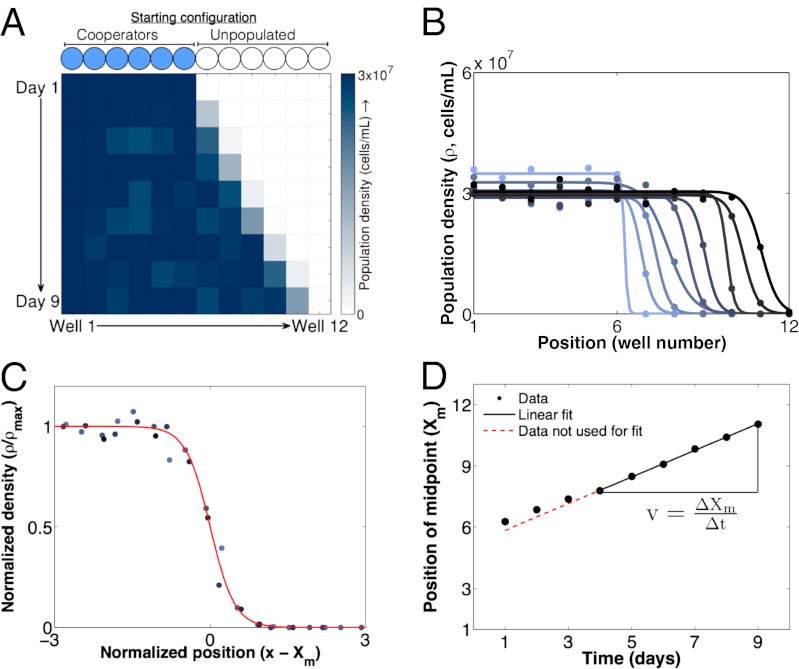
Fig. 2.
Cooperator populations move as a traveling wave. (A) The experimentally observed one-dimensional expansion of a pure cooperator population over 9 d (m = 0.5 and dilution factor = 600). (B) Density profiles over time for expanding populations of pure cooperators (darker colors indicate later time points). Circles are measurements of population density at a particular time and spatial position. Lines are fits of individual profiles to the hyperbolic tangent function derived in SI Text. (C) An overlay of the density profiles from the last 6 d of the experiment (darker circles indicate later time points). Each profile is normalized to the maximum density found in the bulk population ( max) and shifted by its midpoint position (Xm). The first 3 d are not included, because the expanding population had not yet reached a steady-state profile. The red line shows a theoretical fit to the hyperbolic tangent function derived from a standard reaction–diffusion model of expanding populations (discussed in SI Text). (D) We measure the velocity of the traveling wave by plotting the position of the density profile midpoint (Xm) vs. time and then finding the slope of the line. As in C, the first 3 d are not included.

