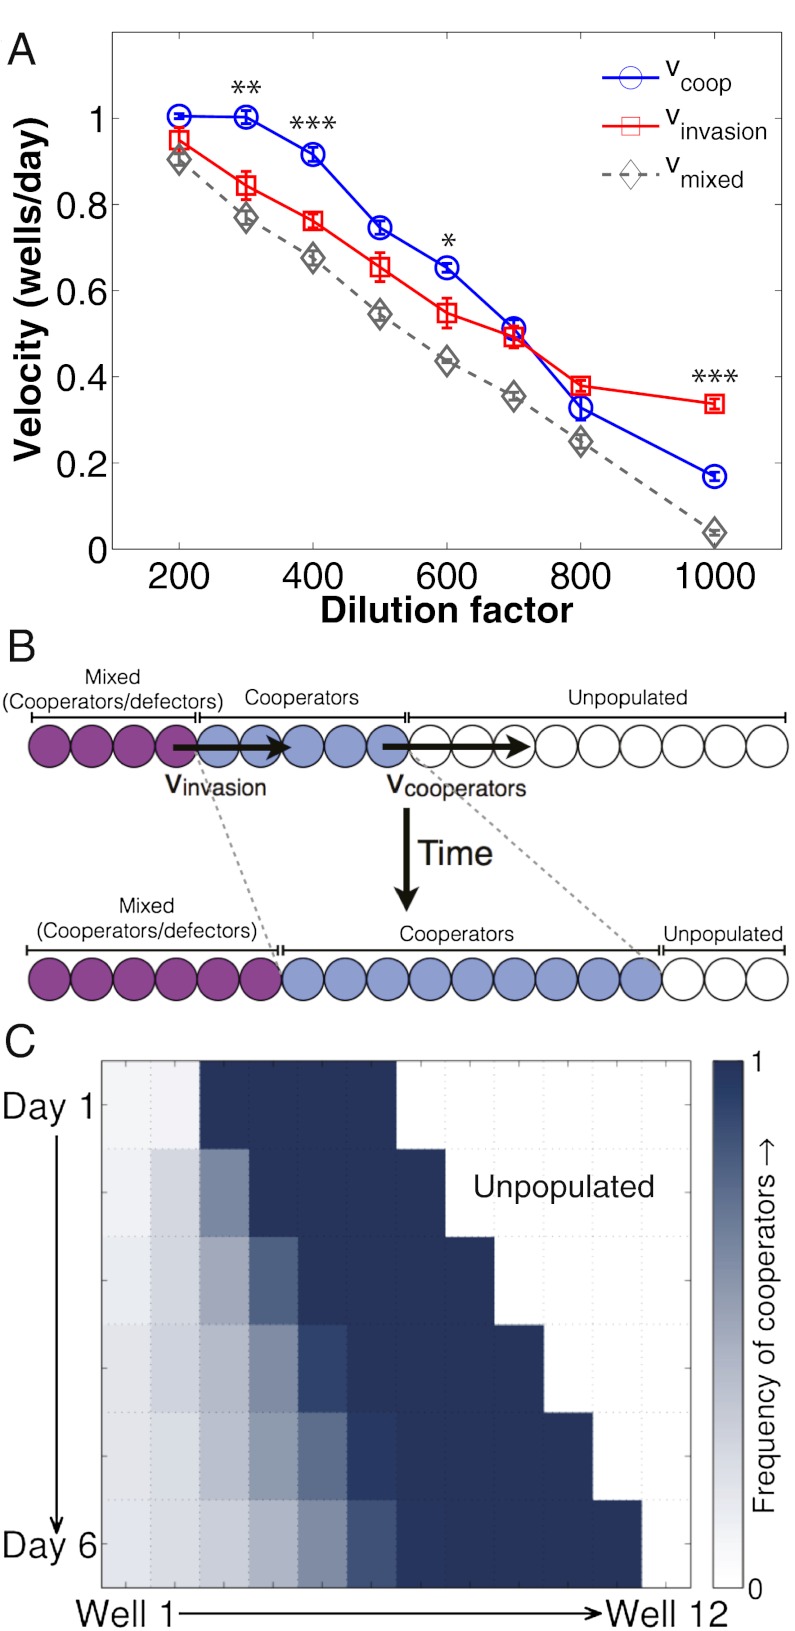
Fig. 5.
Cooperators can “outrun” an invading defector wave. (A) Measurement of the velocities of pure cooperators (vcoop), invading defectors (vinvasion), and the mixed cooperator-defector wave (vmixed) over a range of dilution factors indicates two regimes: (i) at high dilution factors, defectors invade more quickly than the cooperators can escape (vinvasion > vcoop) and (ii) at low dilution factors, cooperators can outrun the invasion (vcoop > vinvasion). Error bars for the velocities are SEs in the slope of the Xm vs. time plot. Asterisks indicate the magnitude of the P value for the difference between vcoop and vinvasion at a particular dilution factor (*P < 0.05, **P < 0.01, ***P < 0.001). (B) A schematic depicting the case in which cooperators can outrun defectors, in which the region occupied by the cooperators increases over time, even as the defectors invade. (C) Experimental observation of cooperators outrunning an invading wave of defectors (m = 0.5 and dilution factor = 400). At this dilution factor, ∆v = vcoop – vinvasion ∼ 0.2 wells/d. Over 5 d, the “headstart” region containing pure cooperators increases from four to nearly five wells, consistent with the observed ∆v.

