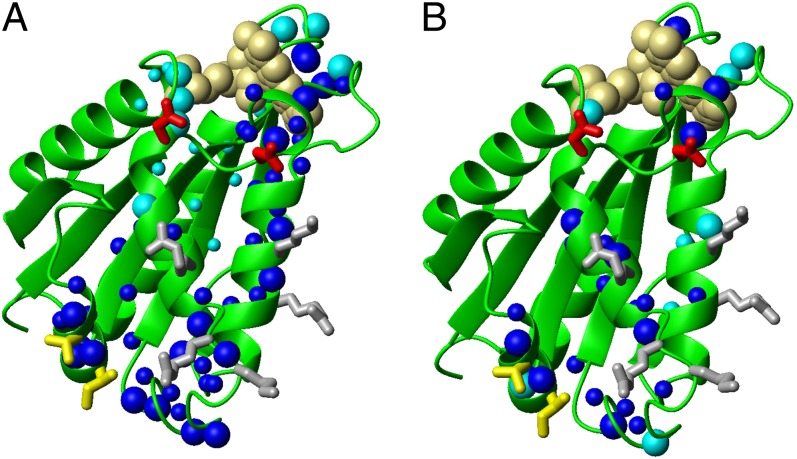
Fig. 4.
Mapping the binding interface of the FMN-binding domain of Ndor1 interacting with [2Fe-2S]-anamorsin. (A and B) Ribbon representations of the FMN-binding domain showing as spheres backbone NHs of the residues experiencing chemical shift variations upon interaction with (A) [2Fe-2S]-anamorsin and (B) [2Fe-2S]-CIAPIN1-single. Large blue spheres, residues showing large chemical shift changes and characterized by relative solvent accessibility above 50%; small blue spheres, residues showing large chemical shift changes but featuring relative solvent accessibility lower than 50%; large cyan spheres, residues showing small chemical shift changes with concomitant broadening effects and with relative solvent accessibility above 50%; small cyan spheres, residues showing small chemical shift changes with concomitant broadening effects and with relative solvent accessibility lower than 50%. Positively charged (gray), negatively charged (red), and hydrophobic (yellow) side chains which are highly solvent exposed in the interacting region are indicated.

