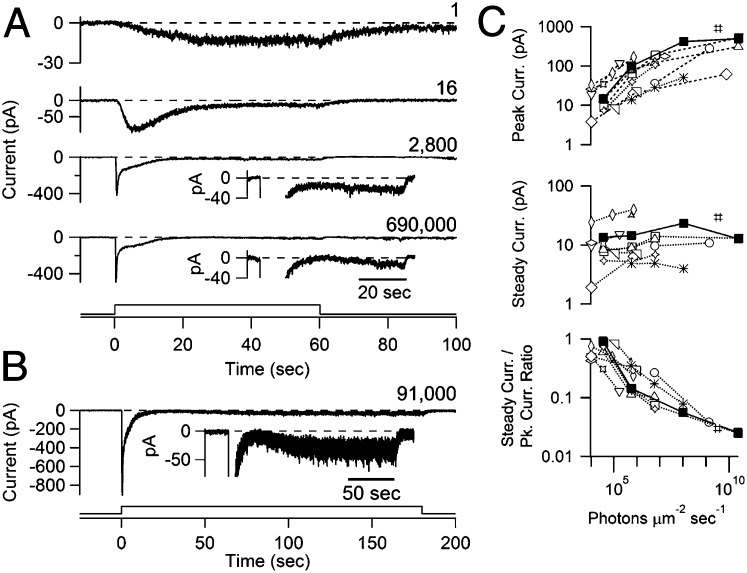
Fig. 1.
Responses of ipRGCs to long steps of light. Perforated-patch, voltage-clamp recordings (−80 mV) of ipRGCs were obtained in flat-mount retina at 23 °C. (A) Responses of a cell to 1-min steps of diffuse light, increasing in intensity from top to bottom: 3.5 × 10⁴, 5.7 × 10⁵, 1.0 × 10⁸, and 2.4 × 10¹⁰ photons per square micron per second; light was at 480 nm except for the brightest, which was white but expressed as equivalent 480-nm photons. Relative light intensity is indicated on the right of each trace. Note the different scalings of ordinates. Insets are the same traces plotted on an expanded ordinate and contracted time scale. (B) Response of a different cell to a 3-min step of white light equivalent to 3.2 × 10⁹ photons per square micron per second of 480-nm light (250-μm spot centered on soma). (B, Inset) Expanded ordinate and contracted time scale to show a transient, nearly complete loss of photocurrent attributable to adaptation, followed by a slow rise to steady plateau. (C) Properties of step responses plotted (for 15 cells) against light intensity, consisting of the peak current attained during the step, the steady current at the end of the step, and the ratio of the two. Each cell is denoted by a different symbol, with filled symbols corresponding to the cell in A. The steady currents at the highest intensity are likely to be somewhat smaller than true steady state, owing to their not having reached plateau at the time of measurement. Dispersion in the data are likely attributable to variation in sensitivity among cells and in the spot size used for stimulation. Light monitors are shown at the bottom of A and B. Ames medium with blockers of fast-synaptic transmission was used (Materials and Methods).

