Fig. 2.
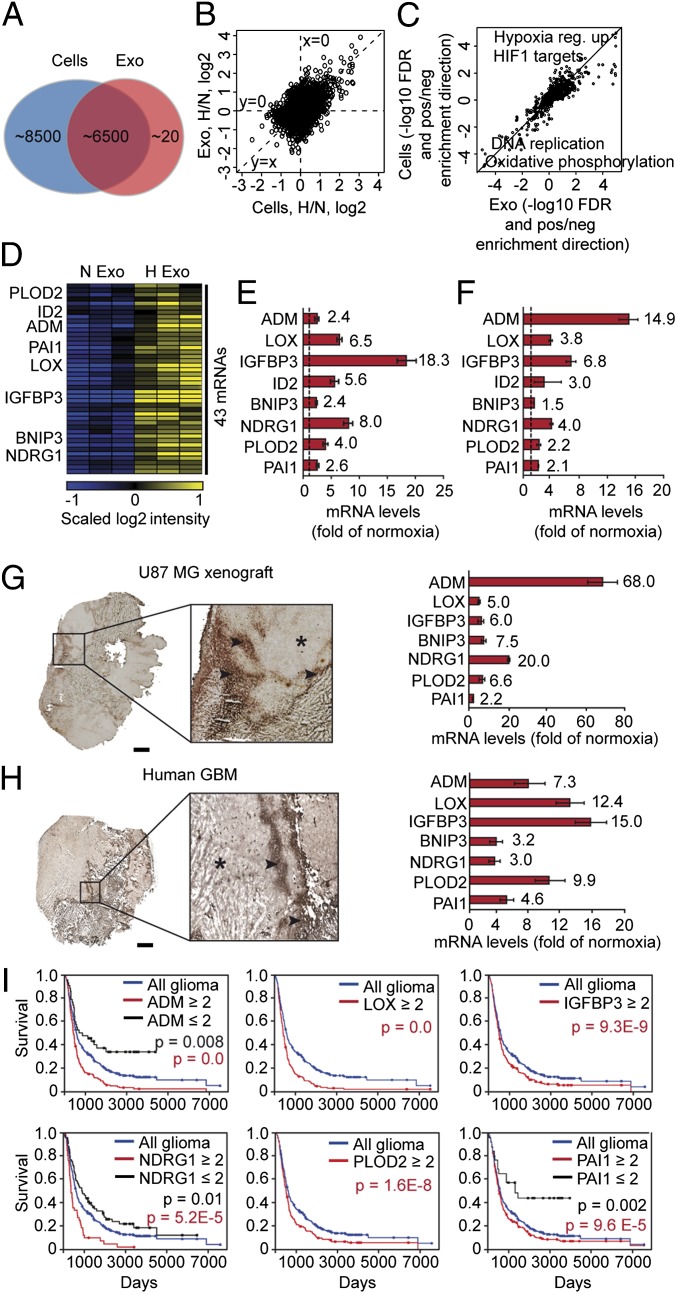
The hypoxic transcriptional profile of exosomes reflects the hypoxic signaling response of GBM cells and tumors. (A) Number of transcripts detected by microarray analysis in GBM cell-derived exosomes and GBM cells. (B) Ratios of hypoxia/normoxia intensities plotted as log2 scale for cells and exosomes. (C) False discovery rates (−log10 space) relating to gene set enrichment analysis. Positive value, up-regulation in hypoxia; negative value, down-regulation in hypoxia of a specific gene set. (D) Heat map of 43 transcripts with significantly higher expression levels in exosomes secreted by hypoxic compared with normoxic GBM cells. (E) Validation of hypoxic induction of indicated mRNAs in exosomes by qRT-PCR. Data are presented as fold increase in hypoxic compared with normoxic exosomes ± SD and are representative of three independent experiments. Values beside bars indicate fold change in hypoxic exosomes. (F) Similar experiment as in E performed with GBM cells. (G and H) Identification of the hypoxic exosome gene expression profile in U87 MG GBM xenografts and GBM patient tumors. Laser-capture microdissection of hypoxic (stars) and normoxic (arrowheads) tumor regions was performed as described in SI Materials and Methods and analyzed for the expression of indicated transcripts by qRT-PCR. (Scale bar: 2 mm.) (I) Kaplan–Meier survival curves of hypoxia-regulated transcripts, as indicated. Blue lines, median expression level of all gliomas (n = 343). Black lines, expression ≤ twofold compared with median. Red lines, expression ≥ twofold compared with median.

