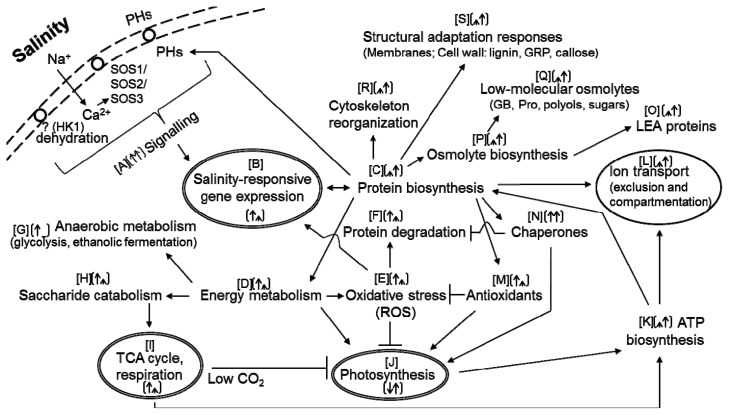
Figure 2.
A summarising scheme showing general plant response to salinity at cellular level and indicating differences between glycophytes (left arrows in diagrams showing quantitative changes) and halophytes (right arrows in diagrams showing quantitative changes). Arrow (↑) means an increased relative abundance and arrow (↓) means a decreased relative abundance of a given plant response (metabolic process) under salinity, respectively, deduced on the results of comparative proteomic studies. The length of the arrow indicates the relative magnitude of a quantitative change deduced from changes in relative abundance of the proteins that participate in a given process (Table 2). Two lengths of arrows were used in the scheme; in case of short arrows, the quantitative change in protein abundance in proteins involved in a given process is generally smaller than in case of long arrows. References: (A) Signalling [19,21,22,89]; (B) Salinity-responsive gene expression [22,76,91]; (C) Protein biosynthesis [22,59,61]; (D) Energy metabolism [22,23,61]; (E) Oxidative stress [60,72,74]; (F) Protein degradation [26,60,70,78]; (G) Anaerobic metabolism [56,58,73]; (H,I) Saccharide catabolism; TCA cycle, respiration [22,28,62]; (J) Photosynthesis [16,26,29]; (K) ATP biosynthesis [22,61,70,86,88]; (L) Ion transport [22–24,51,57,82,87]; (M) Antioxidants [22,23,28,60,61,72,76,80,88,89]; (N) Chaperones [22,25,72,74,75,81,84,89,92]; (O) LEA proteins [33,92–95]; (P) Osmolyte biosynthesis [19,21–23,26]; (Q) Low-molecular osmolytes [19,21,22,26,70]; (R) Cytoskeleton reorganization [22,26,60,65,73,82]; (S) Structural adaptation responses [27,28,34,57,70,78].

