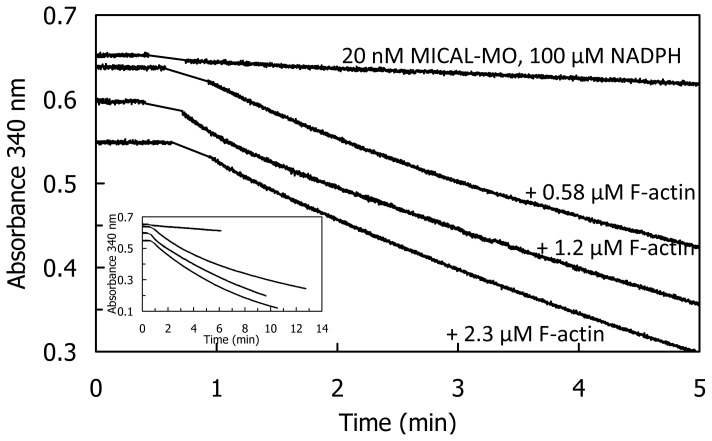
Figure 14.
Time-course and extent of NADPH oxidation in the presence of human MICAL-MO and varying F-actin concentrations. Human MICAL-MO (20 nM) and NADPH (100 μM) were added to a solution containing the indicated concentrations of F-actin in F-buffer (9 mM Tris/HCl, pH 8.0, 0.18 mM CaCl2, 1.1 mM ATP, 1.3 mM DTT, 45 mM KCl, 1.8 mM MgCl2). The absorbance changes at 340 nm were monitored. The inset shows the same traces but on a different time-scale. Reprinted from [70] with permission from Elsevier.

