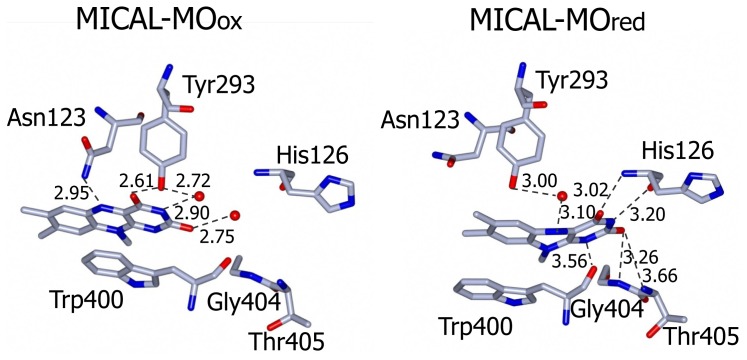
Figure 9.
Details of the FAD environment in the “flavin out” and “flavin in” conformations of MICAL-MO. The figure is drawn based on [3]. The view is obtained by vertically flipping the models in Figure 6 with an approximately 45° rotation. The FAD ribityl side chain is cut at C1′. The CCP4MG program was used to generate the figure [72].

