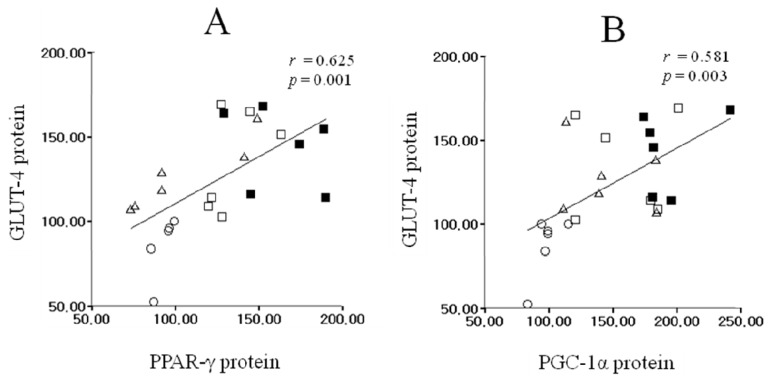
Figure 4.
Correlation among PPAR-γ, PGC-1α, and GLUT-4 protein expressions in skeletal muscle. These relationships represented significant positive correlation (Pearson’s correlation coefficient A: r = 0.625, p = 0.001; B: r = 0.581, p = 0.003). The equations for the fitted lines are y = 0.56x + 54.67 (A), and y = 0.42x + 60.98 (B). ○: HS, △: HE, □: OS, ■: OE.

