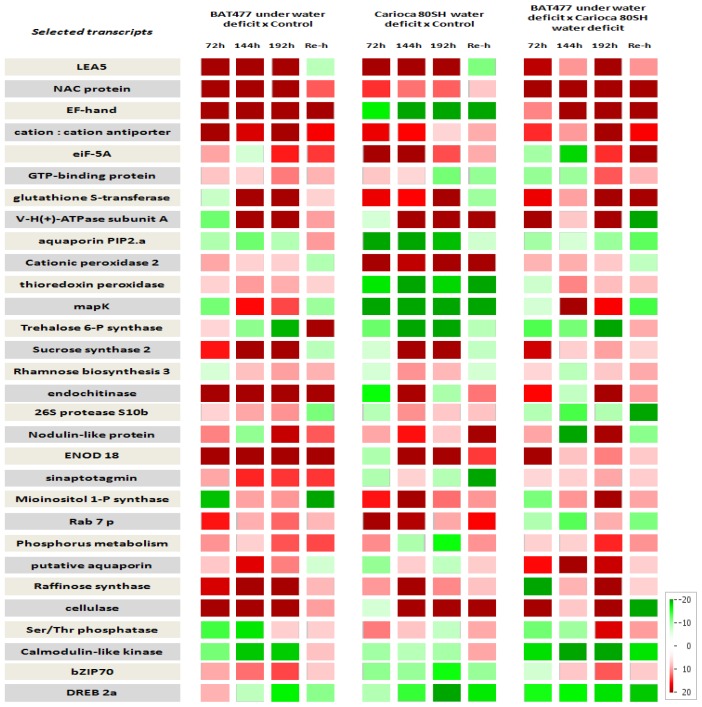
Figure 4.
HeatMap containing the expression patterns of the 31 selected ESTs obtained by RT-qPCR. Gene expression patterns ranging from −20 (green color mostly down-regulated) to +20 (red color as mostly up-regulated). Relative Expression was achieved by contrasting different samples: Column 1 − BAT 477 treated/untreated; Column 2 − Carioca 80SH treated/untreated; Column 3 − BAT 477 treated/Carioca80SH treated.

