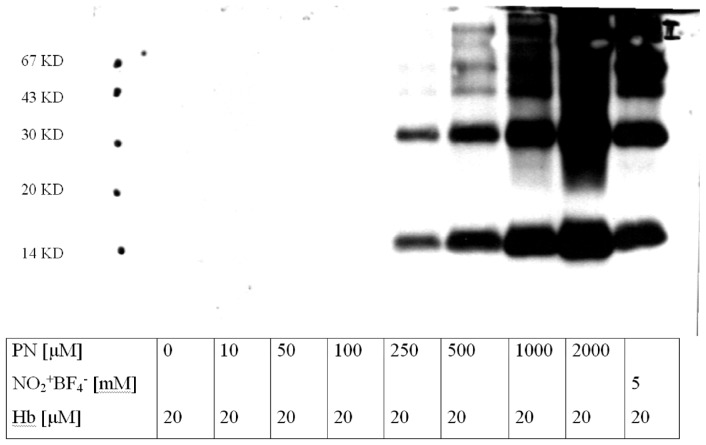
Figure 2.
Detection and quantification of tyrosine nitration in bovine hemoglobin (Hb). Western blot analysis of purified Hb (20 μM) treated with increasing amounts of authentic peroxynitrite (PN, 0–2000 μM) or nitronium tetrafluoroborate (5 mM). The figure shows the hybridization with a monoclonal anti-3-nitrotyrosine antibody. Stained bands correspond to the α- and/or β-subunits at 16 kDa as well as to their dimers at around 30 kDa. For corresponding pronase digestion data see Figure S2 in supplementary information.

