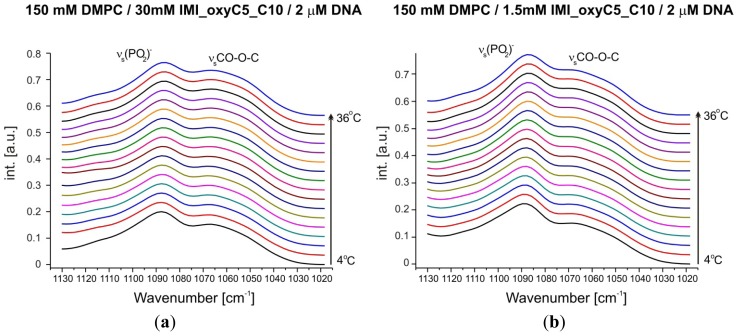
Figure 7.
Selected FTIR absorption spectra in the spectral range of (PO2)− symmetric stretching vibrations at various temperatures and different surfactant concentrations (a,b) obtained for DMPC/IMI_oxyC5_C10/DNA systems. An additional band of CO–O–C symmetric stretching vibration was observed. The spectra are shifted for clarity.

