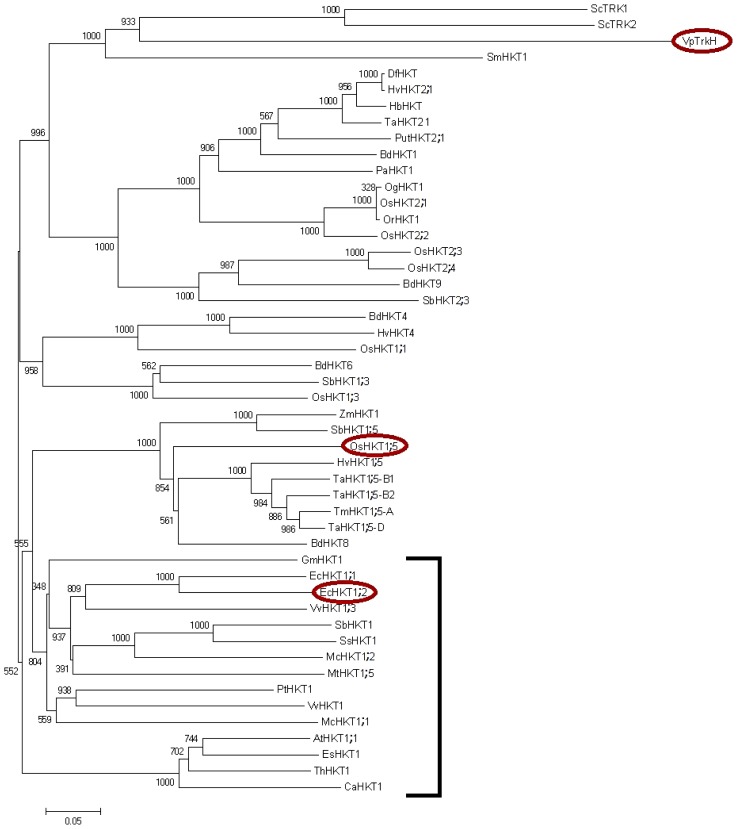
Figure 1.
Phylogenetic analysis of plant HKT transporters. All published sequences were retrieved from the NCBI database and aligned with ClustalX2 [79]. The phylogenetic tree was constructed based on aligned protein sequences using Neighbour-Joining algorithm [80] with a Bootstrap value of 1000 using ClustalX2 [79]. The scale bar indicates the substitution rate per site. All dicotyledonous HKT entries (and none of monocotyledonous ones) are bracketed. The red circles denote proteins that are shown in Figure 2.

