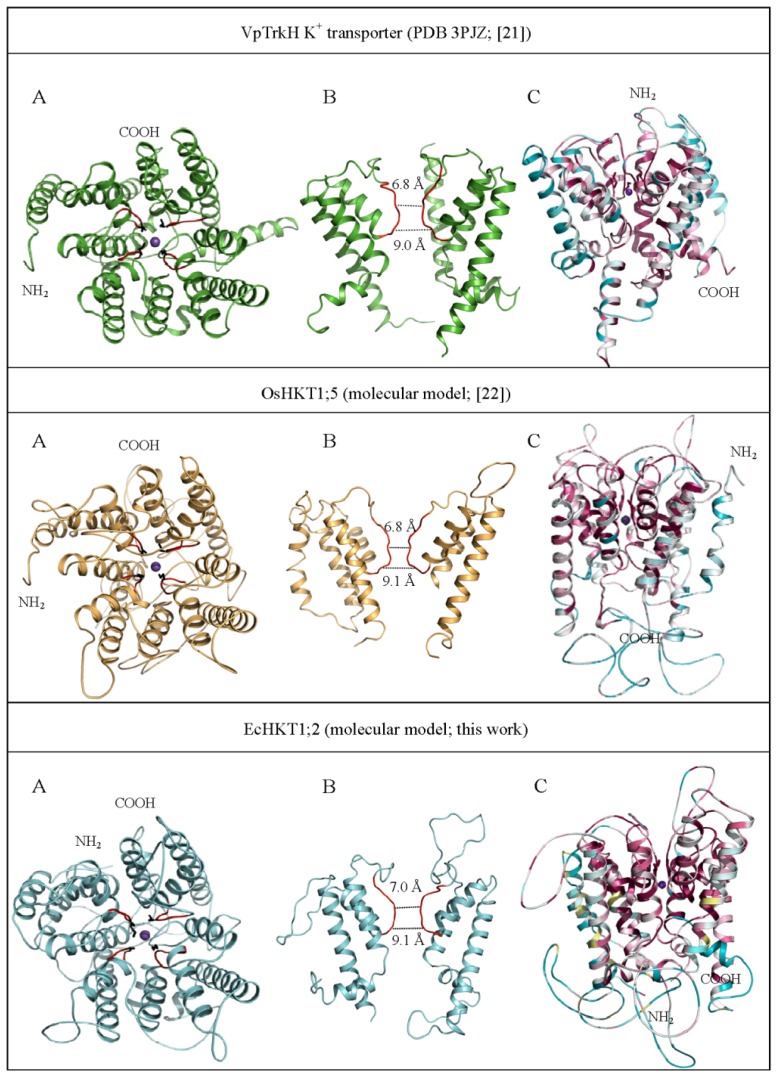
Figure 2.
Cartoon representations of 3D structure of VpTrkH (PDB 3PJZ) (top panels) and molecular models of the Oryza sativa OsHKT1;5 (middle panels) and Eucalyptus camaldulensis EcHKT1;2 (bottom panels) transporters. (A) The overall folds of transporters are coloured in green (VpTrkH) orange (OsHKT1;5) and cyan (EcHKT1;2). Purple spheres indicate the K+ (VpTrkH) and Na+ (OsHKT1;5 and EcHKT1;2) ions. The selectivity filter signatures illustrated in black sticks are: Gly-Gly-Gly-Gly for VpTrkH and Ser-Gly-Gly-Gly for OsHKT1;5 and EcHKT1;2. The residues contained in the selectivity pores are coloured in red. These residues are likely to affect pore rigidity and dispositions of residues controlling cation selectivity and transport rates; (B) The cut-out images show geometry of selectivity pores. Their width dimensions are indicated; (C) Cartoon representations of VpTrkH, OsHKT1;5 and EcHKT1;2 colour-coded by conservation score of amino acid residues as predicted by ConSurf [81]. The views in panels C are rotated by 90° along the x-axis with respect to the views in panels A. The NH2- and COOH-termini of the transporters are shown.

