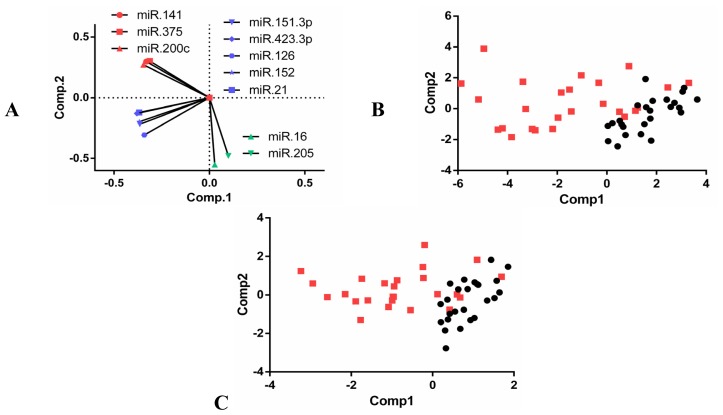
Figure 3.
Principle Component Analysis (PCA) on the ten validated differentially expressed miRNAs. (A) Visual representation of the highly correlated pattern observed in the Pearson’s correlation; (B) PCA using all 10 miRNAs is able to distinguish localized PCa from mCRPC; although (C) PCA using a combination of only miR-141 + miR-151-3p + miR-16 shows a similar ability to separate the two conditions.

