
Figure 2.
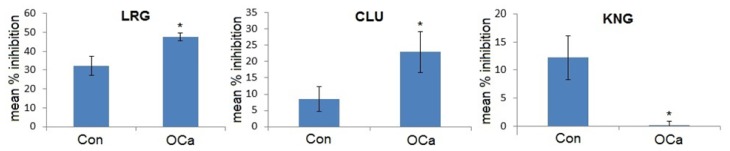
Mean percentage of inhibition of urinary LRG, CLU and KNG in controls (Con) and patients with OCa. Analysis was performed by competitive ELISA. The concentrations of LRG and CLU in the urine samples of OCa patients were significantly higher than those of the controls, while KNG was significantly lower in the OCa patients. The concentrations of proteins present in the samples were proportional to the percentage inhibition of substrate hydrolysis. Asterisk denotes the statistical significance with p < 0.05.