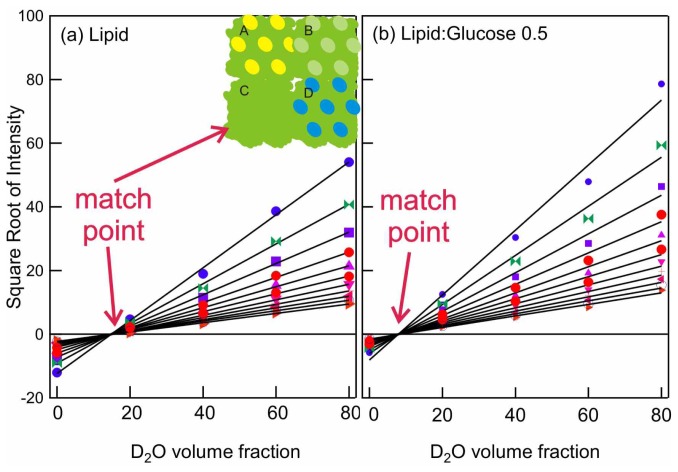
Figure 5.
Square root of intensity vs. D2O volume fraction for the data in Figure 4. A schematic representation where the scattered intensity is proportional to the contrast between the two phases is shown in the inset. In this case, the scattering is due to the contrast, (or difference in scattering length density)2, between the aqueous phase (various ratios of H2O:D2O:D6-glucose) and the lipid phase.

