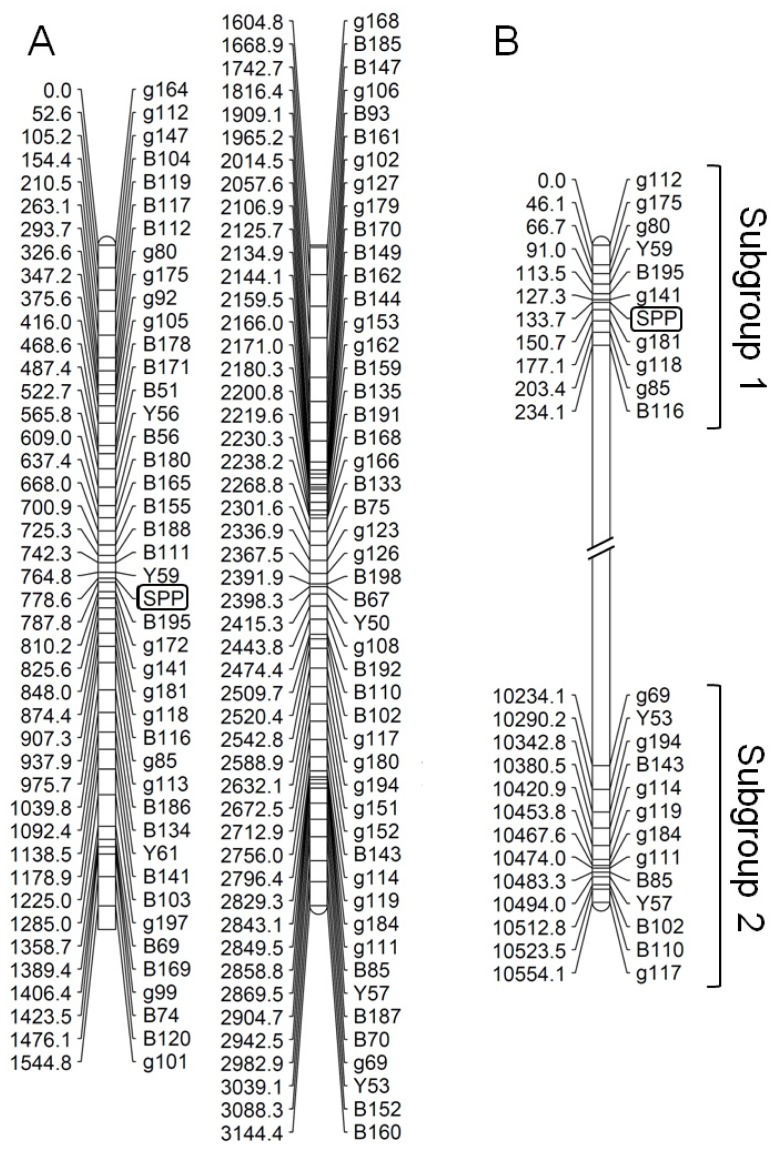
Figure A3.
Linkage maps show the species-associated loci estimated by the maximum likelihood mapping algorithm using JoinMap ver. 4.0 [53]. Linkage group of species-associated loci estimated by criteria of (A) LOD 3.0 and (B) LOD 6.0 are shown. Two linkage subgroups at LOD 6.0 were inferred. The code SPP indicates the “character” as species.

