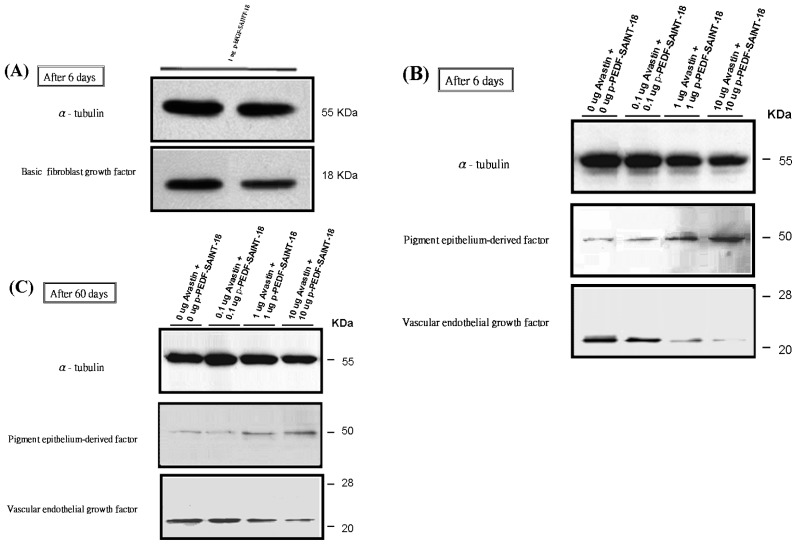
Figure 4.
Levels of bFGF, VEGF and PEDF proteins estimated by western blot analysis. The α-tubulin band was used as the control for normalization. (A) The bFGF bands (molecular weight, approximately 18 kDa) produced with 1 μg of the p-bFGF-encoding plasmid after day 6; (B) Visualization of the PEDF bands (molecular weight, approximately 50 kDa) produced with 0 μg, 0.1 μg, 1 μg, and 10 μg of PEDF-encoding plasmid. This band was also noted in the 0 μg PEDF group due to endogenous PEDF. The inhibition of VEGF expression was more significant in the 10 μg + 10 μg bevacizumab + p-PEDF-SAINT-18 group; (C) On day 60 after administration, the PEDF and VEGF levels within the corneal and subconjunctival substantia propria were determined.

