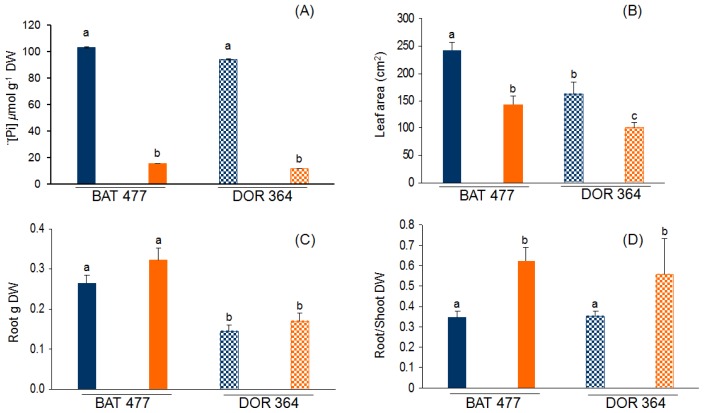
Figure 1.
Effect of phosphorus (P) deficiency on common bean BAT 477 and DOR 364 genotypes. (A) soluble Pi content in leaves; (B) leaf area from fully expanded leaves; (C) root dry weight; (D) root to shoot dry weight ratio. Plants were grown for three weeks under P sufficient (blue bars) or in P deficient (orange bars) conditions. Values are the mean (±SE) from two independent experiments with eight replicates per experiment. Within each panel, bars marked with different letters represent significantly different means according to the statistical analysis (p ≤ 0.05).

