
Figure 6.
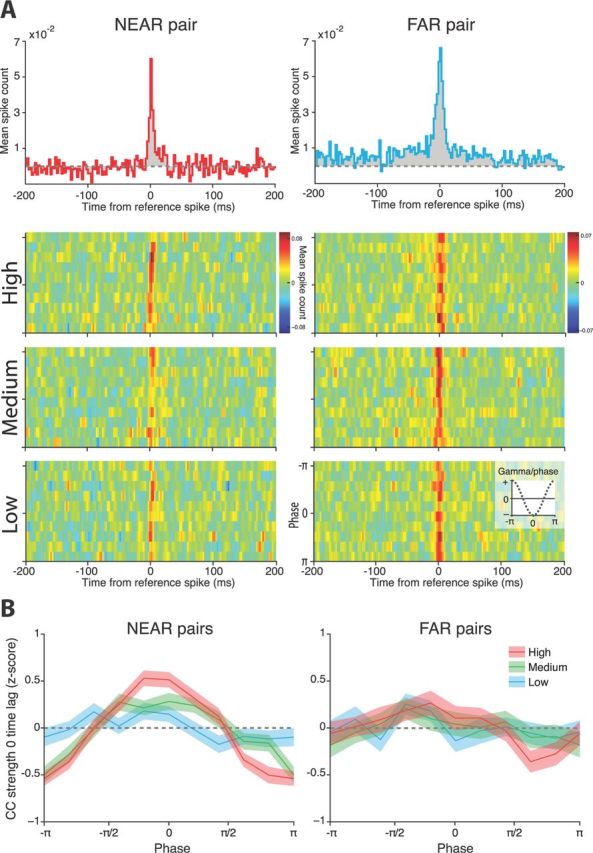
Gamma affected the CC between pairs of sites. A, Example CCs from a NEAR and FAR pair. The topmost graphs show the CC without accounting for the phase and amplitude of gamma. CC strength at the zero time lag was similar between sites. Below are the corresponding gamma-stratified CCs for the same pairs. Low, Medium, and High indicate the percentile amplitude of gamma used for constructing the CCs, whereas the y-axis of each graph is the phase of gamma. Despite their similar overall CCs, the NEAR and FAR pairs differ in their gamma-stratified CCs, with the CC strength in the NEAR pair varying with gamma phase and amplitude. B, We compared the shape of the relationship between CC strength and gamma between all NEAR and FAR pairs during the CS. NEAR sites exhibited greater modulation of their CC by gamma than did FAR sites. Note that −π and π are equivalent. Shaded regions denote ± SEM.