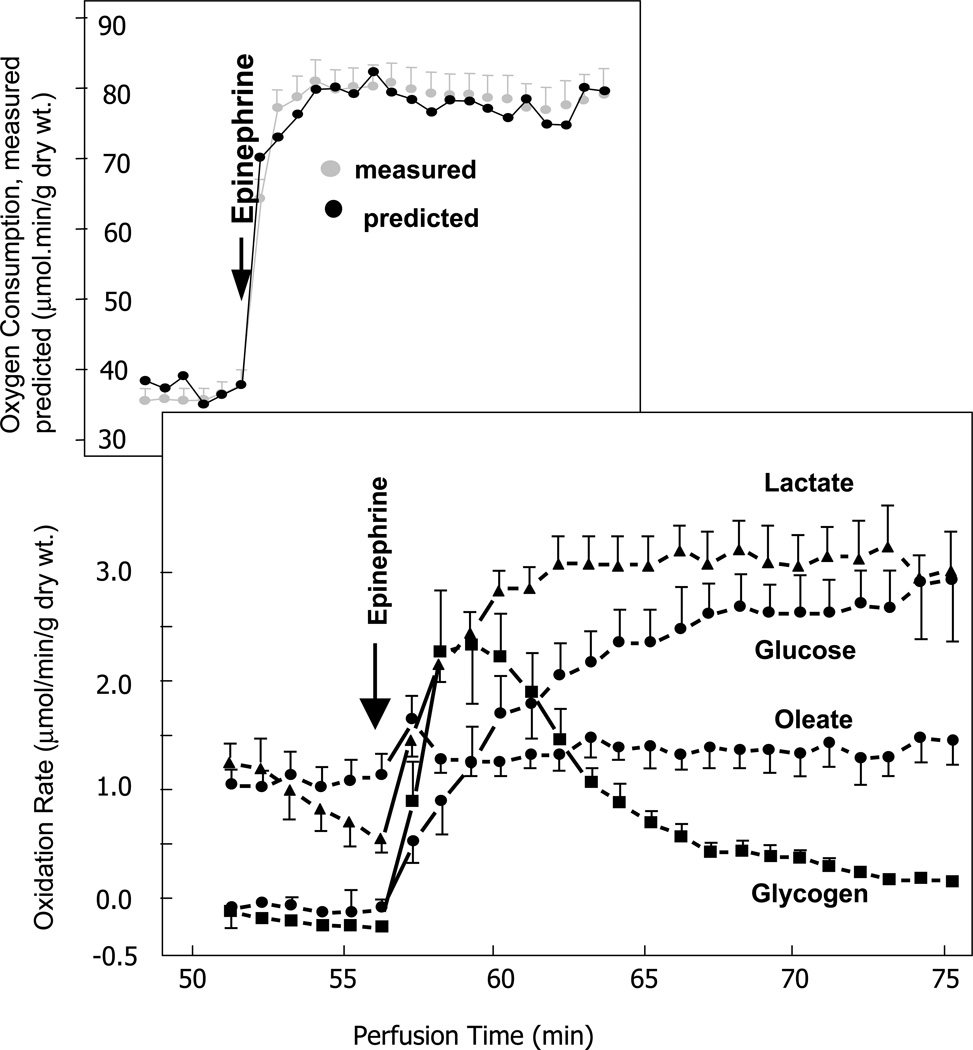
Figure 4.
Rates of substrate oxidation. Rates during the chase period of the protocol are depicted. ●, 14CO2 from exogenous [U-14C]glucose; ■ 14CO2 from [14C]glycogen; ▲, 14CO2 from exogenous [U-14C]lactate; ○, 3H2O from exogenous [9,10-3H]oleate. Values for glycogen were corrected for incomplete labeling assuming uniform isotopic dilution at an enrichment of 54.7%. Values are the mean 6 S.E. for five perfusions in each treatment group. Adapted from reference 47. See text for further details.

