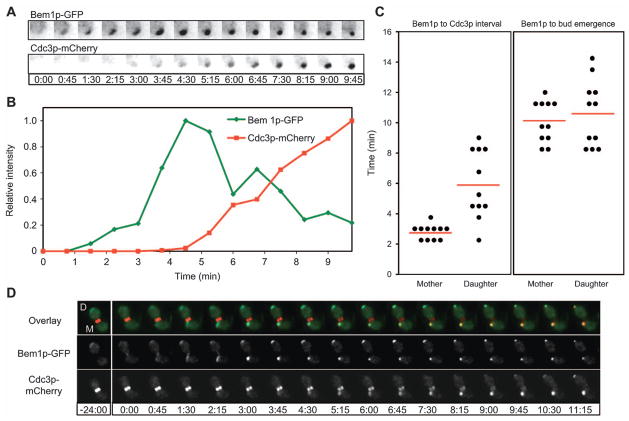
Figure 2. Timing of septin accumulation relative to the polarity marker Bem1p.
(A) Illustrative cell from a deconvolved time-lapse movie of strain DLY11909 showing inverted images (so that fluorescent signal appears dark on light background) of Bem1p-GFP and Cdc3p-mCherry. (B) Quantification of Bem1p-GFP and Cdc3p-mCherry intensity for the cell in (A). (C) The interval between initial Bem1p-GFP and initial Cdc3p-mCherry detection was measured for 22 cells, separated into the 11 component mother and daughter cells (left). The interval between initial Bem1p-GFP and initial bud emergence is plotted for the same cells (right). Red lines indicate average intervals in each case. Mothers and daughters were distinguished by noting which cell displayed apical growth (tip localized Bem1p-GFP) in the previous cell cycle (daughter). (D) Illustrative mother-daughter cell. Time is indicated in min:s.

