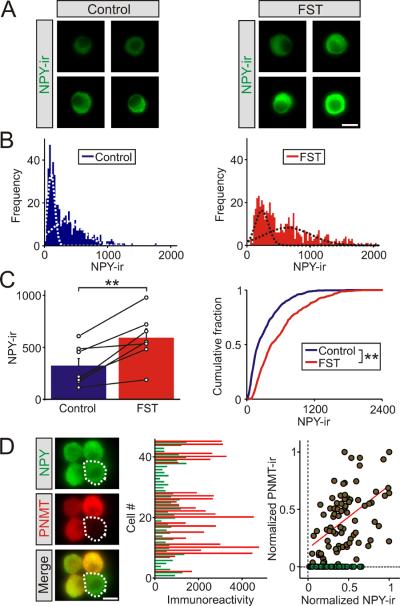
Figure 2. The cold FST induced an increase in NPY expression in adrenal chromaffin cellsin vitro.
(A). Examples of NPY-ir in chromaffin cells from a matched littermate pair of control mice and 1 day after the cold FST. (B). Frequency histograms of the levels of NPY-ir in chromaffin cells from matched control and stressed animals (≥477 cells for each distribution, n = 7 separate experiments). The histograms were each fitted with two Gaussian distributions (dashed lines, R2 = 0.93 and 0.80, respectively). (C). Group data (left panel) showing that the cold FST led to a significant increase in NPY-ir (mean ± SEM, n = 7 independent experiments). The open circles indicate the mean value from each animal (each was calculated from ≥60 chromaffin cells). The black lines link the matched animals from each independent experiment. Cumulative frequency distributions (right panel) confirm that the cold FST led to a significant increase in NPY-ir (≥ 477 cells for each distribution). (D). Examples of chromaffin cells co-stained for NPY and PNMT. Histogram (middle panel) of the levels of NPY- and PNMT-ir in individual cells from a typical experiment shows that NPY is expressed in both epinephrine and norepinephrine cells. Normalization of the levels of NPY and PNMT immunoreactivity reveals a population of NPY+/PNMT−cells (green symbols). A linear fit of the immunoreactive signal from the NPY+/PNMT+cells (red line) shows a very weak correlation between the two, consistent with the idea that the levels of NPY and PNMT expression are independent (R = 0.52, 125 cells from n = 3 independent experiments; 66% of cells were PNMT positive / epinephrine chromaffin cells). Scale bars 10 μm. **P < 0.01.

