
Table 2.
Physician perspective on the appropriate patient body weight for obesity diagnosis and weight loss counseling by personal body weight status, %
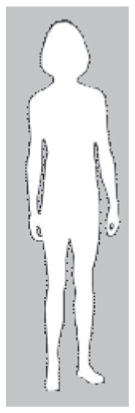
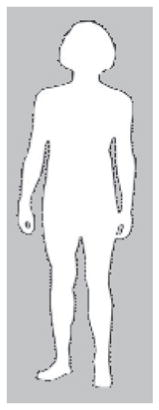
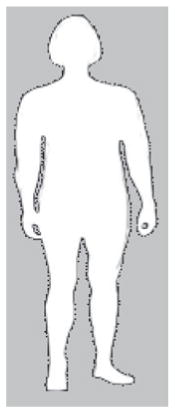
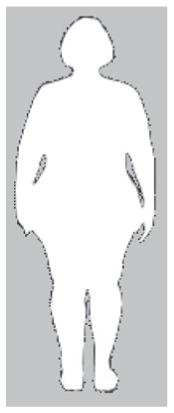
| Patient BMI image
|
P value | |||||
|---|---|---|---|---|---|---|
|
|
|
|
|
||
| Patient BMI threshold for… | ||||||
| Recording an obesity diagnosis | ||||||
| Physician BMI | ||||||
| Normal BMI (N = 230) | 1.6% | 0.1% | 36.0% | 55.0% | 6.4% | 0.506 |
| Overweight or obese (N = 267) | 0.1% | 1.5% | 42.0% | 50.0% | 5.6% | |
| Initiating a weight loss conversation | ||||||
| Physician BMI | ||||||
| Normal BMI (N = 230) | — | 9.3% | 72.0% | 18.0% | 1.1% | 0.024 |
| Overweight or obese (N = 267) | — | 5.1% | 64.0% | 30.0% | 1.4% | |
The patient weights (from left to right) correspond to the following BMI categories: normal BMI (BMI: 18.5–24.9 kg/m2), overweight (BMI: 25.0–29.9 kg/m2), class I obese (BMI: 30.0–34.9 kg/m2), class II obese (BMI: 35.0–39.9 kg/m2), and class III obese (BMI: ≥40.0 kg/m2).
P value < 0.05.