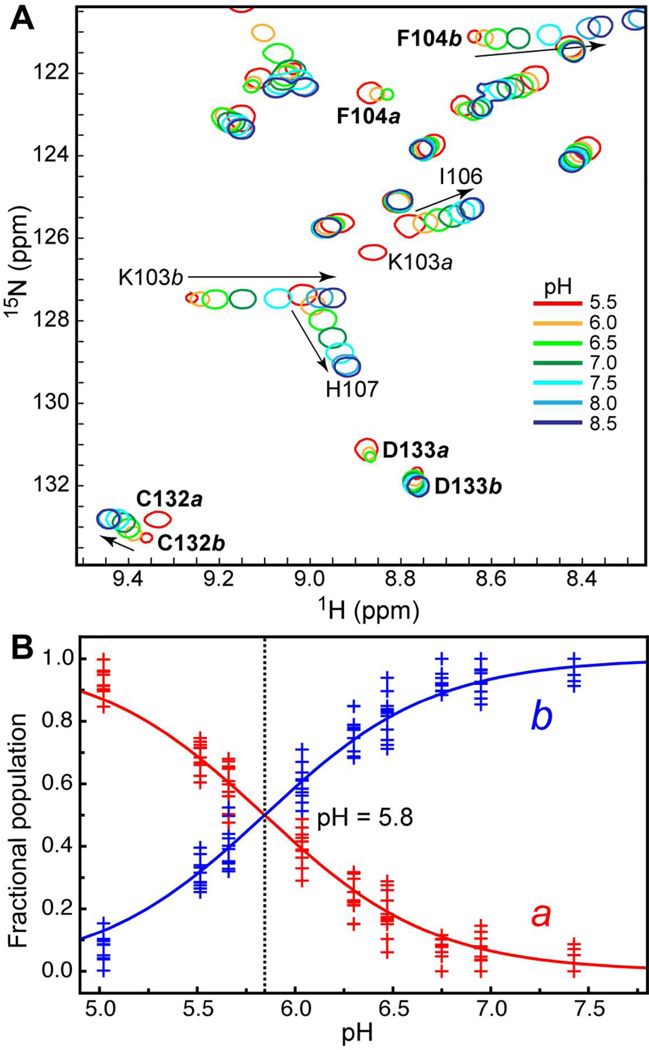
Figure 5.
pH dependence of the C1Bα50 HSQC spectra. (A) Expansion of the 15N-1H HSQC spectra showing examples of residues with fast and/or slow exchange behavior. (B) pH dependence of populations a and b. The fractional populations were calculated using the cross-peak volumes of all residues that have well-resolved peaks in the two conformations. The data points correspond to different exchanging residues in C1Bα50. The solid line represents a global fit of the data to Eqs. (2) and (3).

