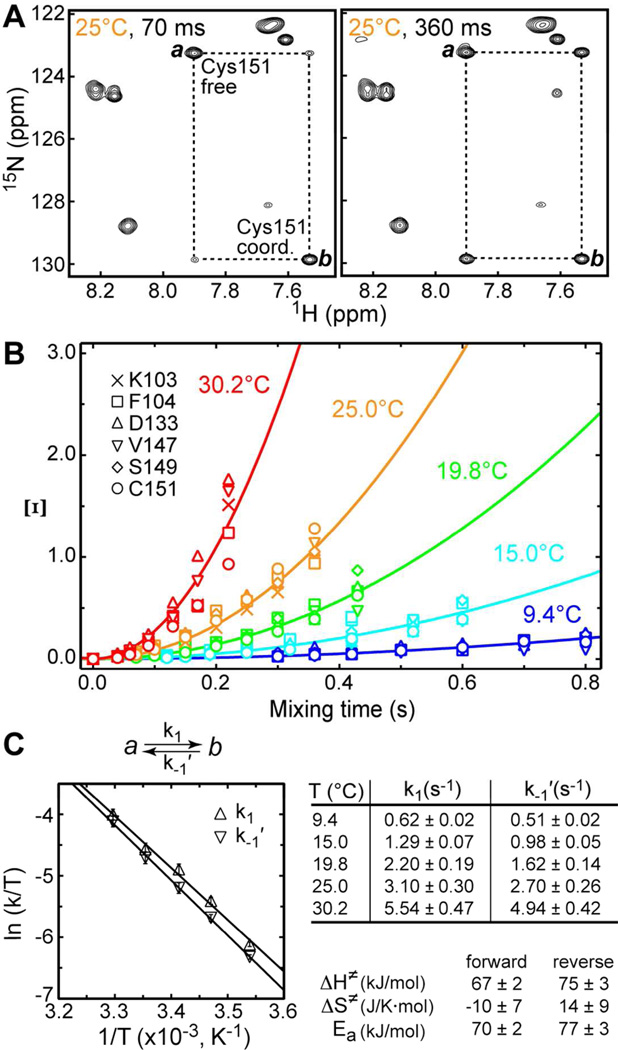
Figure 7.
Kinetics of Cys151 inter-conversion between thiolate and thiol forms. (A) Expansions of the ZZ-exchange spectra showing the buildup of the Cys151 exchange cross-peaks at two mixing times, 70 and 360 ms. (B) Ξ at pH = 5.75 as a function of mixing time and temperature. Solid lines are the fits to Eq. (8). (C) Eyring plots for the forward (k1) and reverse (k−1′) kinetic rate constants that are summarized in the table. ΔH≠,ΔS≠, and Ea are the activation enthalpy, entropy, and energy, respectively.

