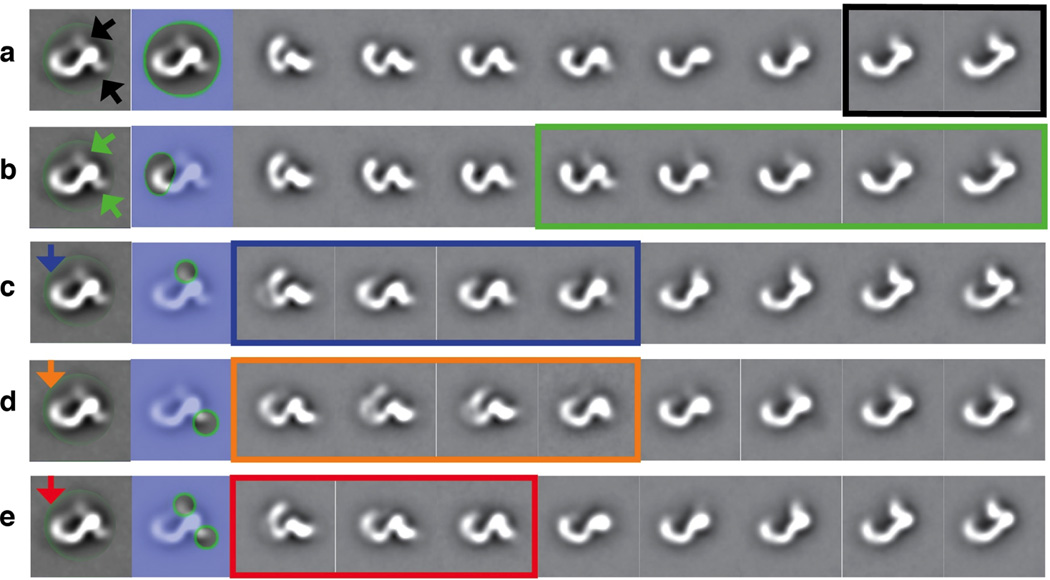
Figure 4.

Mobility independence within Ltn1’s termini in Maskiton. (a–e) For all masking procedures, the aligned average of the full data set is shown at left, followed by the masked region, and 8 distinct class averages resulting from the masked classification at right. Arrows indicate heterogeneity identified within the outlined/boxed region in the class averages. The aligned dataset was masked with (a) a circular mask to show overall global heterogeneity, (b) an N-terminus mask (left region) to show increased heterogeneity within the C-terminus (right region) of Ltn1, and (c–e) three different C-terminus masks to show increased heterogeneity within the N-terminus of the protein.
